Valve and Pipeline Leak Detection and Monitoring System
- Introduction
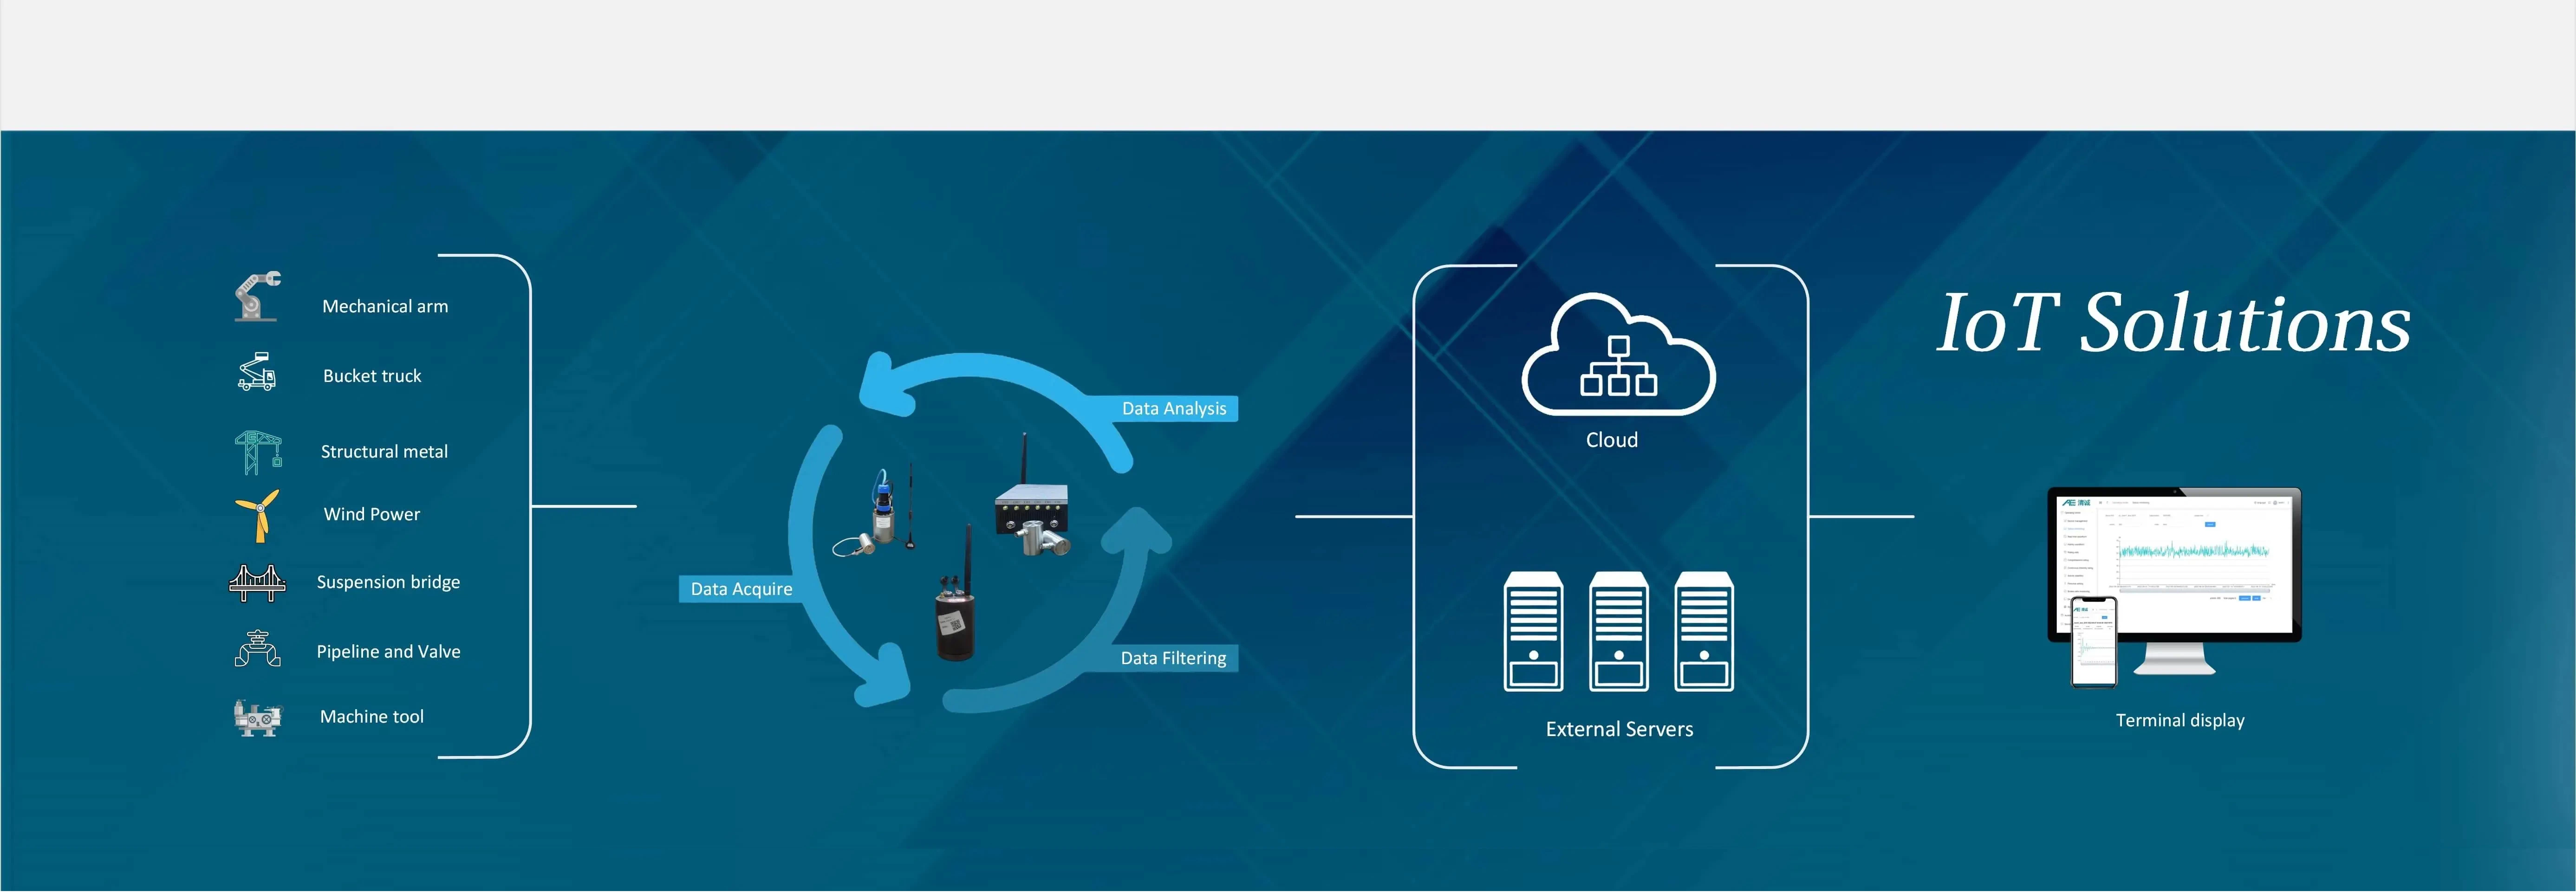
- Solutions
- Data Analysis
- Case Study
Leak Detection Principle:
If there happens the leakage in the pipeline and valves, the elastic mechanical waves are generated due to turbulence, friction, liquid gasification, and solid particle collision, which is the phenomenon of leakage producing acoustic waves, also known as the generalized acoustic emission phenomenon.
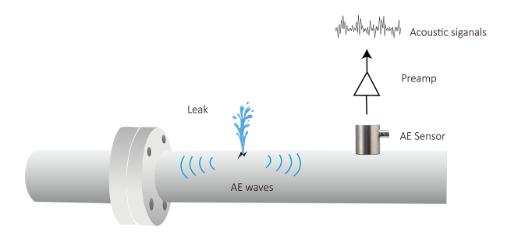
The leak detection and leak monitoring systems of valves and pipelines use acoustic wave (acoustic emission) technology to detect, analyze, and monitor the status and locations of leaks, allowing users to obtain real-time information about the measured pipelines and valves and receive early warnings in case of leaks, helping to prevent property damages or catastrophes.
Leak AE Detection Factors:
The leakage from any liquid or gas or mixture of both forms can generate acoustic emission signals to be detected. The main affecting factors of the AE signals are:
| Factors | High Intensity Signal | Low Intensity Signal |
| Medium Form | Gas/ Mixture of gas and liquid | Liquid |
| Medium Viscosity | Low | High |
| Flow Speed | High | Low |
| Pressure Difference | High | Low |
The pressure difference and the liquid temperature are one the main affecting factors of signal intensity.
Scope of Applications:
The leak detection and leak monitoring system is suitable for various objects and also applicable to difficult or inaccessible environments such as high and low temperature, nuclear radiation, flammable, explosive and extremely toxic environments.
- Valve leak detection and monitoring
- Pipeline leak detection and monitoring
- Pressure vessel leak detection
- Storage tank leak monitoring
- Boilers steam valve leak detection
- Heat exchangers leak detection, etc.
Solution 1 - Pipeline Leak Detection & Monitoring
Pipeline Leak Detection Principle:
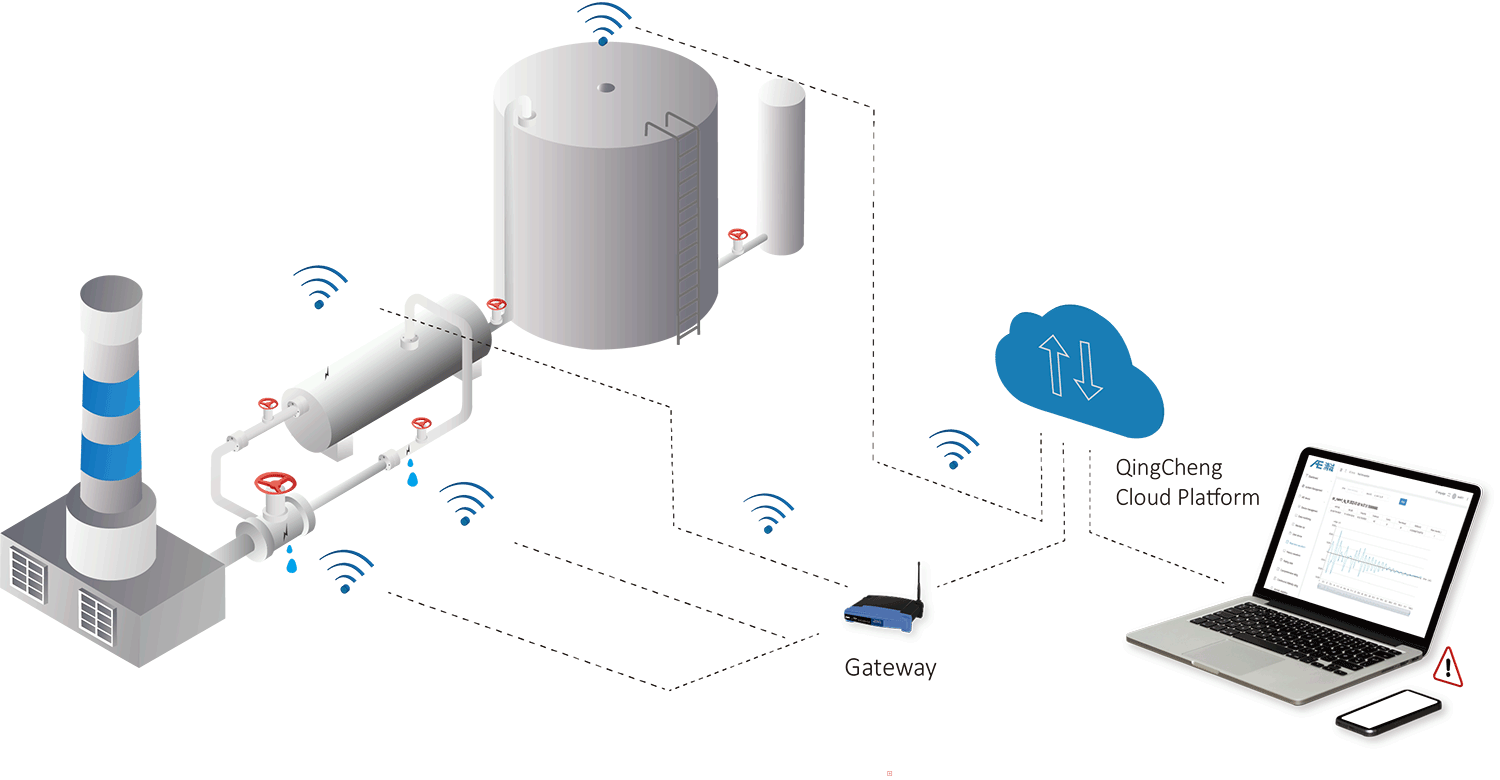
The acoustic waves generated by the friction and rupture of the medium propagate along the surface of the material and are received by acoustic emission (AE) sensors. The data acquisition unit analyzes and processes the received acoustic wave signals, and sends the data to the cloud platform through a 4G/WiFi network. Users log in to the cloud platform to view real-time/historical data at any time. The cloud platform determines the level of the alarms based on the data and criteria transmitted by the device, and sends out the alarm results to the client (computer, mobile phone, email, SMS, etc.) in real time.
Solution Products and Installation
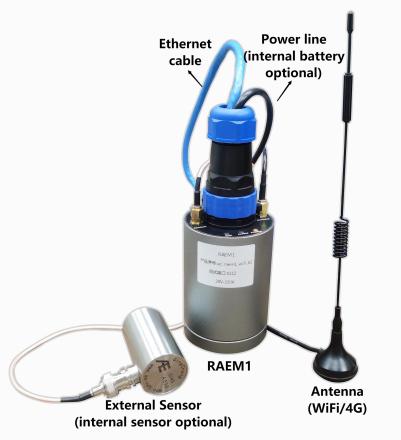 |
Product Model | RAEM1 |
| Channel Number | Single | |
| Sample Rate | 2MHz, 16-bit | |
| Waveform Collection | Supported | |
| Analog Filter | High-pass: 30kHz, 125kHz; Low-pass: 80kHz, 175kHz | |
| Digital Filter | 256th order FIR filter. Any value within 0kHz-1000kHz can be set as high-pass, low-pass or band-pass filters | |
| Communication | Ethernet, WiFi, 4G, RS485 | |
| Dimension | 62mm x 100mm (D x H) | |
| Weight | 220g |
A. Sensor layout and installation
After applying some couplant at the bottom of the sensor, the sensor is installed directly on the surface of the tested pipeline. The contact surface of pipeline should remove the coating or insulation if any. Use tapes or magnetic holders to fix the sensor in place and to ensure good coupling between the sensor and the tested surface.
B. Layout of sensor cables
The sensor output end is connected to a coaxial cable (the specific length is determined on site), and according to the installation requirements on site, it is wired through a conduit or trunking to the designated installation position of the RAEM1.
C. Installation of RAEM1 Unit
Install the equipment boxes at designated locations on the installation site, with RAEM1 units arranged inside the boxes. Install the 4G/Wi Fi antennas on the top of the boxes, and provide 220V AC or 12V DC power supply for equipment use on site. There should be cable trays or similar equipment for wiring and routing at the installation site, and 4G network access should have mobile network signals.
Solution 2 - Valve Leak Detection & Monitoring
Pipeline Leak Detection Principle:
The acoustic waves generated by the friction and rupture of the medium propagate along the surface of the material and are received by acoustic emission (AE) sensors. The data acquisition unit analyzes and processes the received acoustic wave signals, and sends the data to the cloud platform through a 4G/WiFi network. Users log in to the cloud platform to view real-time/historical data at any time. The cloud platform determines the level of the alarms based on the data and criteria transmitted by the device, and sends out the alarm results to the client (computer, mobile phone, email, SMS, etc.) in real time.
Solution Products and Installation
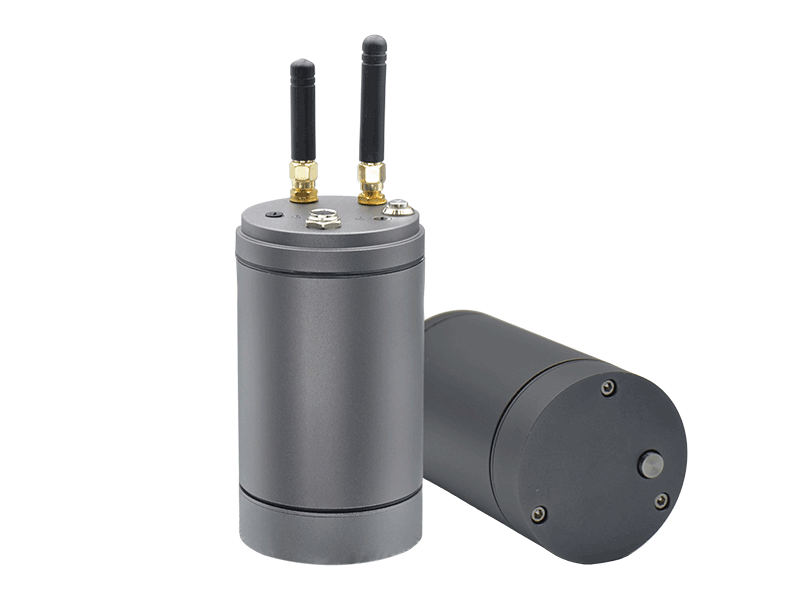 |
Product Model | RAEM2 |
| Channel Number | Single | |
| Sample Rate | Optional 200k/s, 500k/s, 1000k/s, 2000k/s | |
| Sample Length |
2000Ksps:500us~15000us 1000Ksps: 1000us~30000uss 500Ksps:2000~60000uss 200Ksps:5000~150000us |
|
| Digital Filter | 128th order FIR filter. Any value within 0kHz-1000kHz can be set as high-pass, low-pass or band-pass filters | |
| Digital Filter | 256th order FIR filter. Any value within 0kHz-1000kHz can be set as high-pass, low-pass or band-pass filters | |
| Communication | Bluetooth, optional 4G, LoRa | |
| Dimension | (D x H) 60mm x 105mm or 60mm x 117mm | |
| Weight | < 500g (battery, magnets and antenna included) |
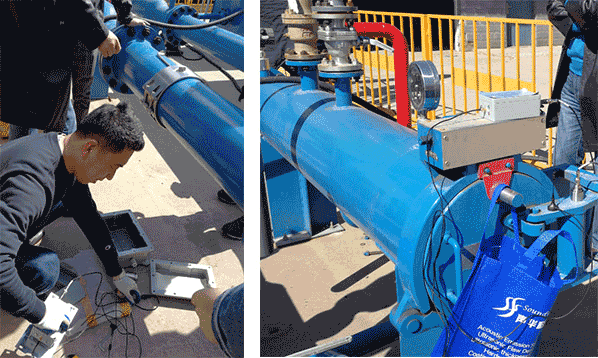
Due to the built-in acoustic emission sensor and battery in the RAEM2 device, simply apply couplant to the bottom of the RAEM2 and install it directly on the surface of the tested valve. Use the tapes to secure the installation and to ensure good coupling between the device bottom and the polished tested surface.
Display & Analysis

The QingCheng IoT Cloud Platform, along with Alibaba Cloud, AWS, and other platforms, can be used as the data terminal for display, storage, and analysis. Below are the features of the QingCheng IoT Cloud Platform as examples:
- Real-time AE parameters and waveform displays
- Remote control and configure the devices
- Historical data storage and downloads
- Remote system firmware upgrade
- Result classification and alarm notifications for abnormal data
The RAEM1 can use the SWAE analysis software to receive, display and analysis AE data in real-time or to replay post data.
- Various views and analytical functions, location analysis, correlation graph analysis, waveform analysis, Fast Fourier Transform, wavelet transform and more;
- Data storage and exportable to other formats for third party analysis.
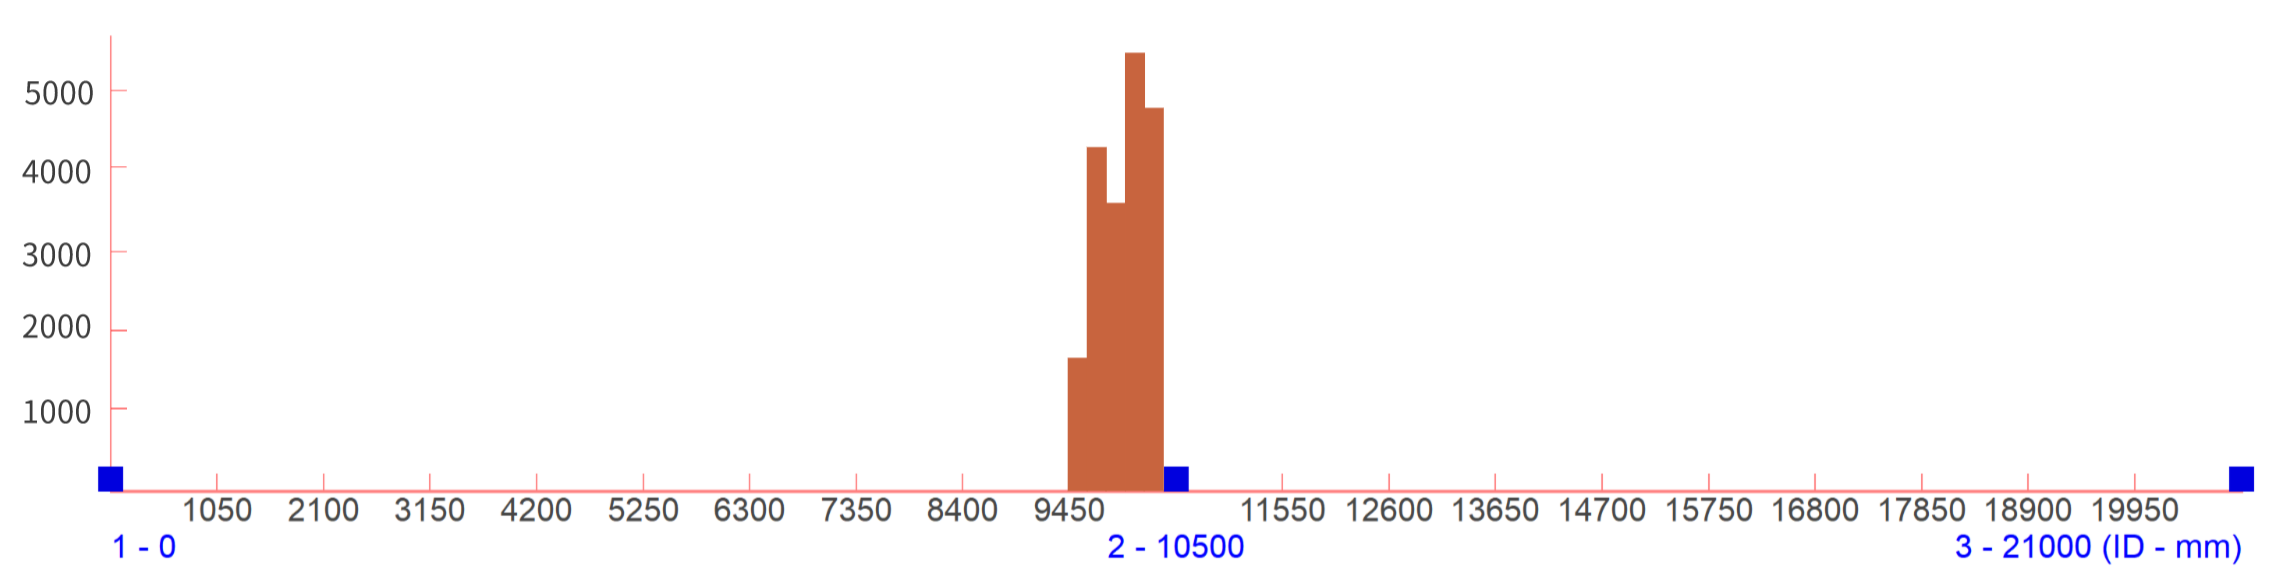
Linear location (Time difference algorithm)
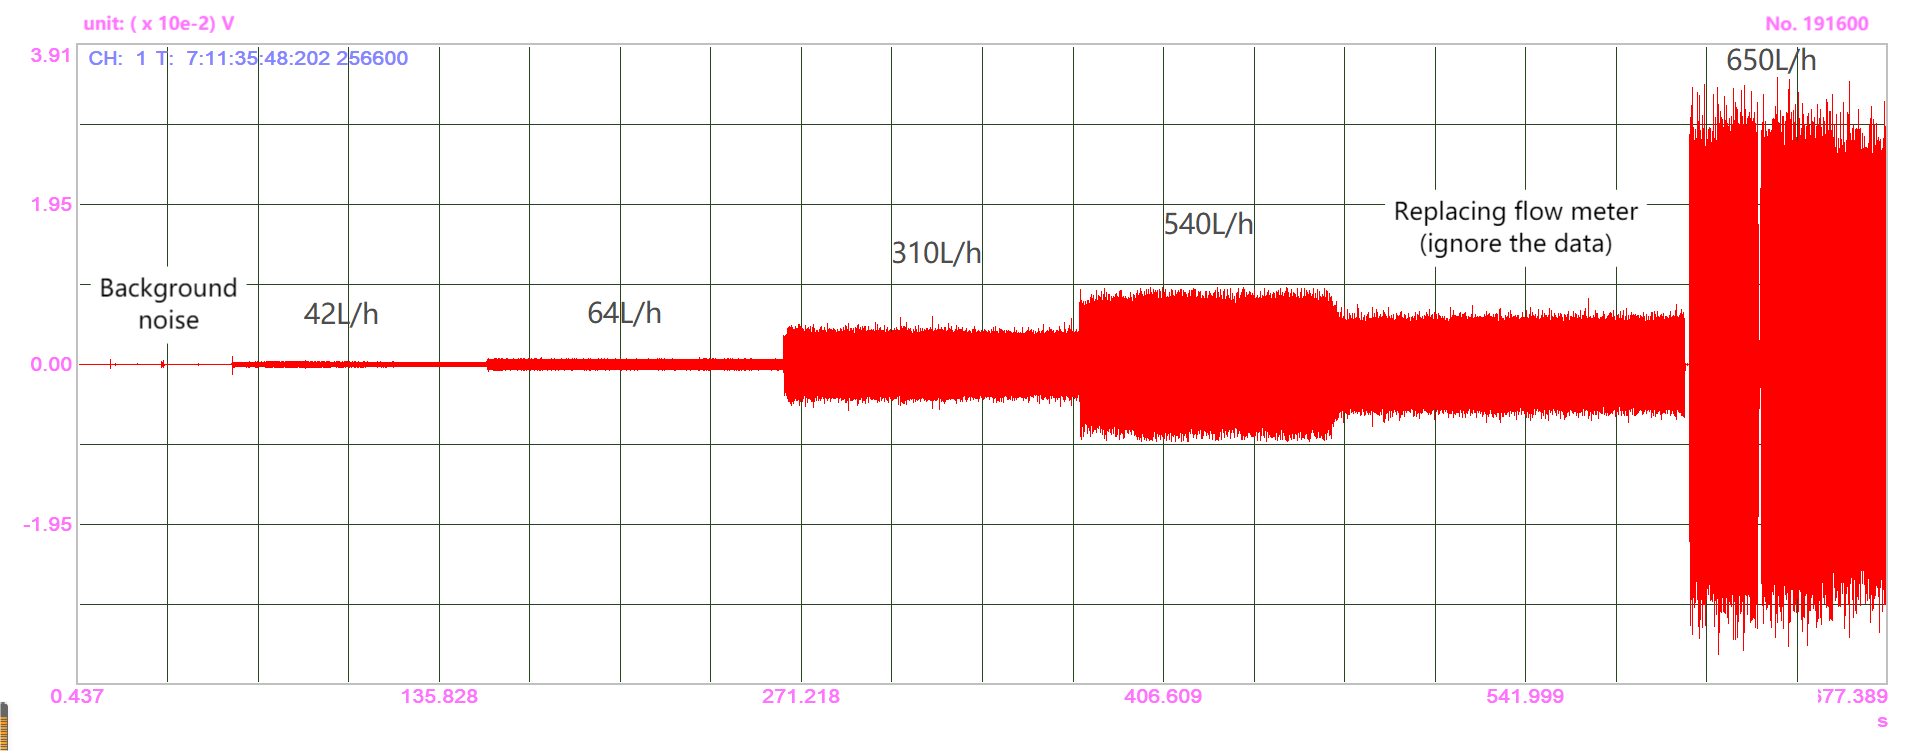
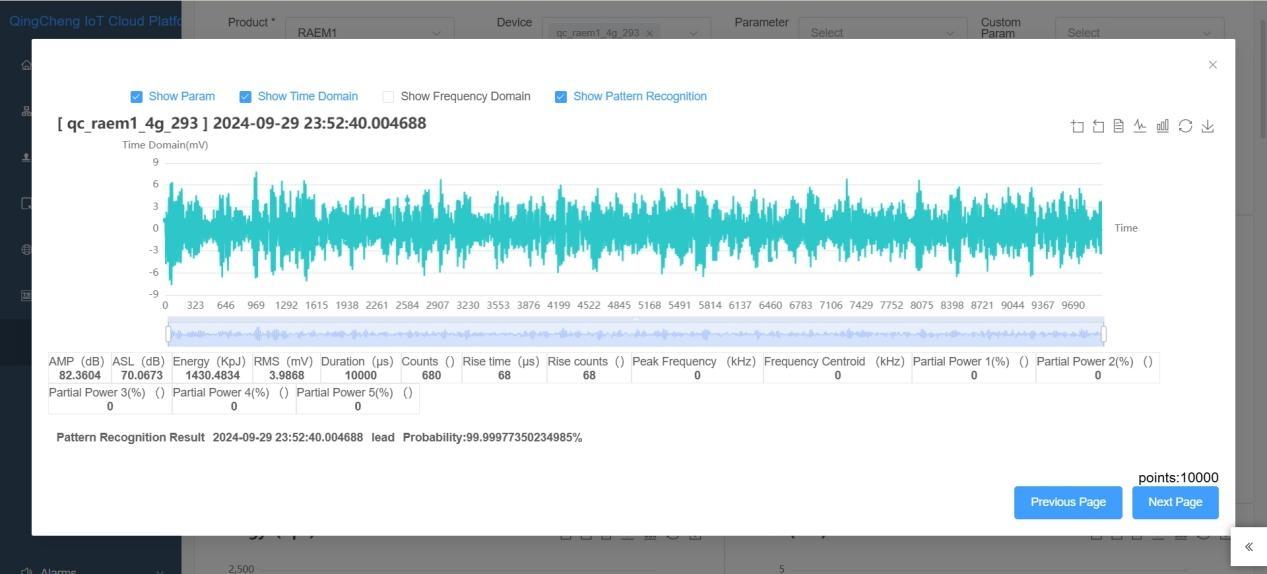
Leak waveform in time domain
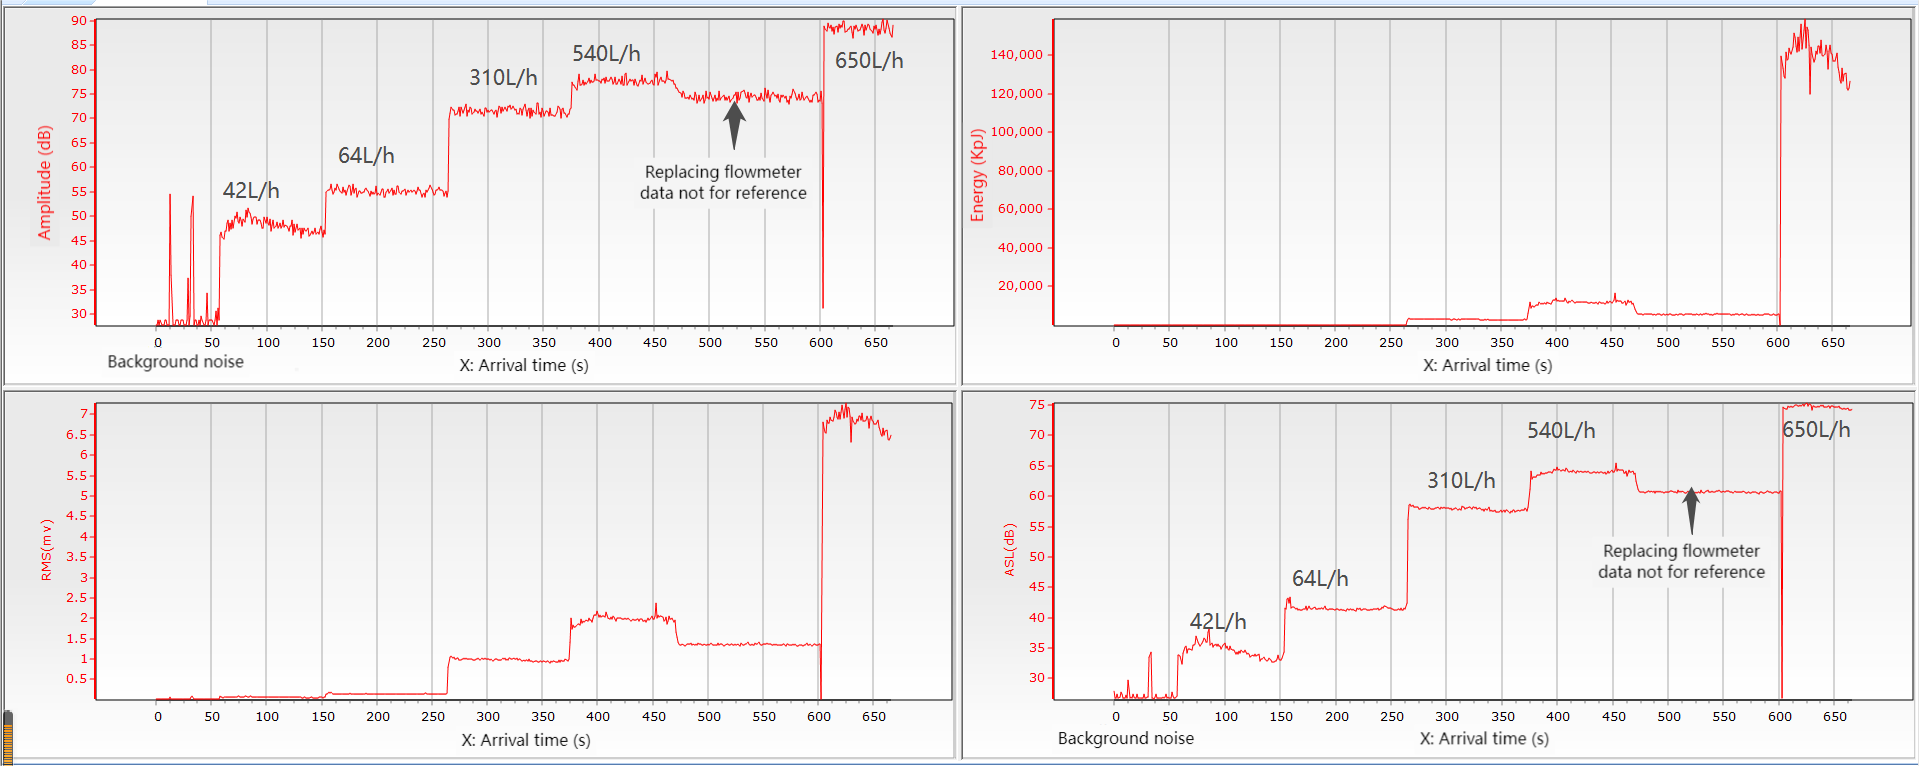
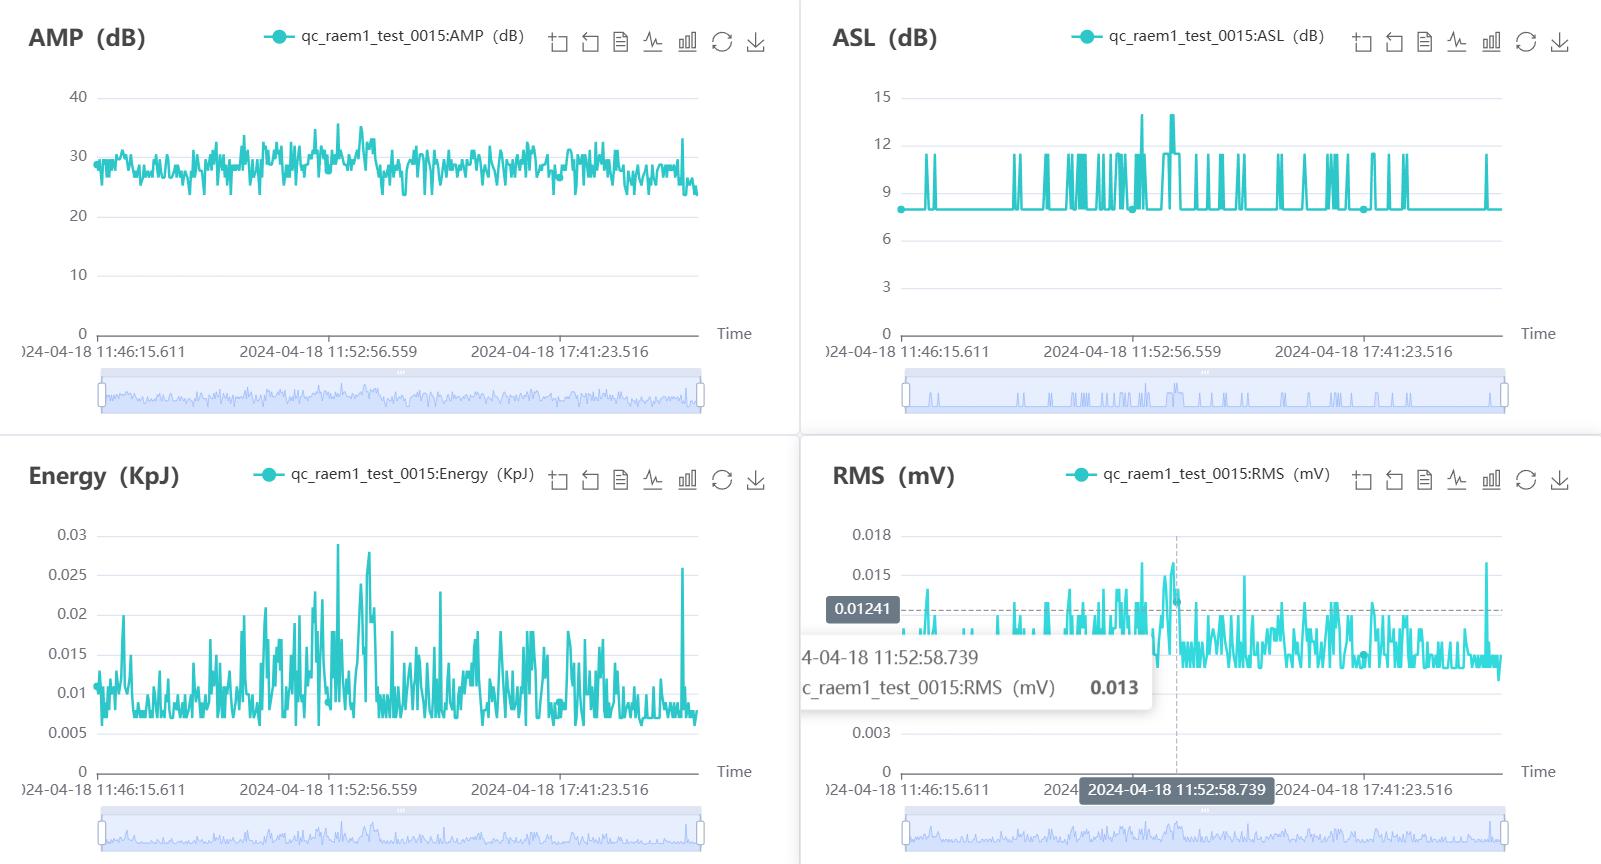
Several Parameters verse time correlation graphs
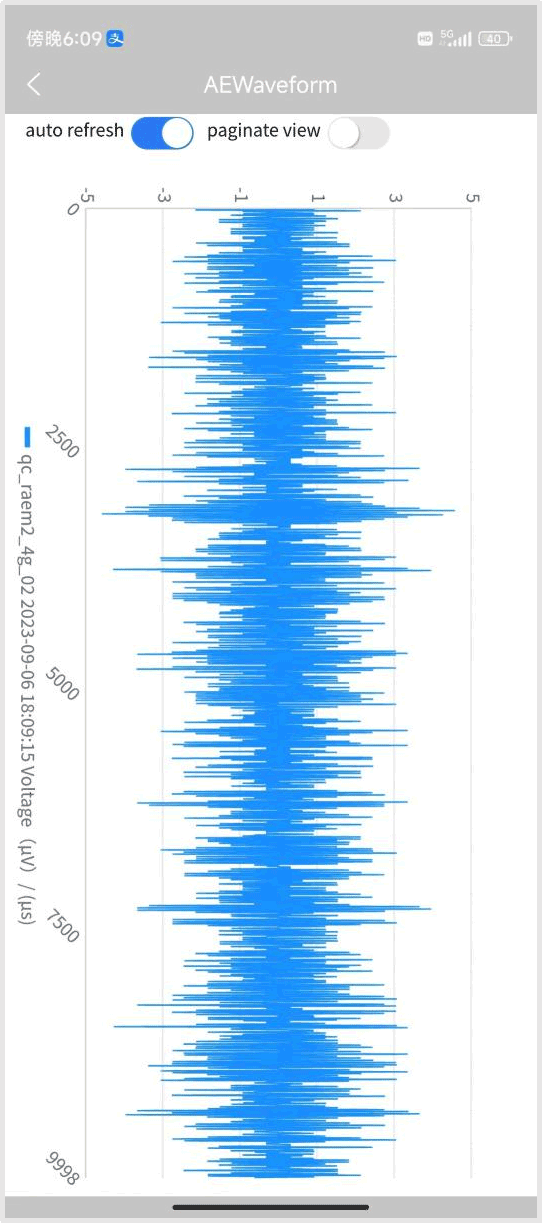
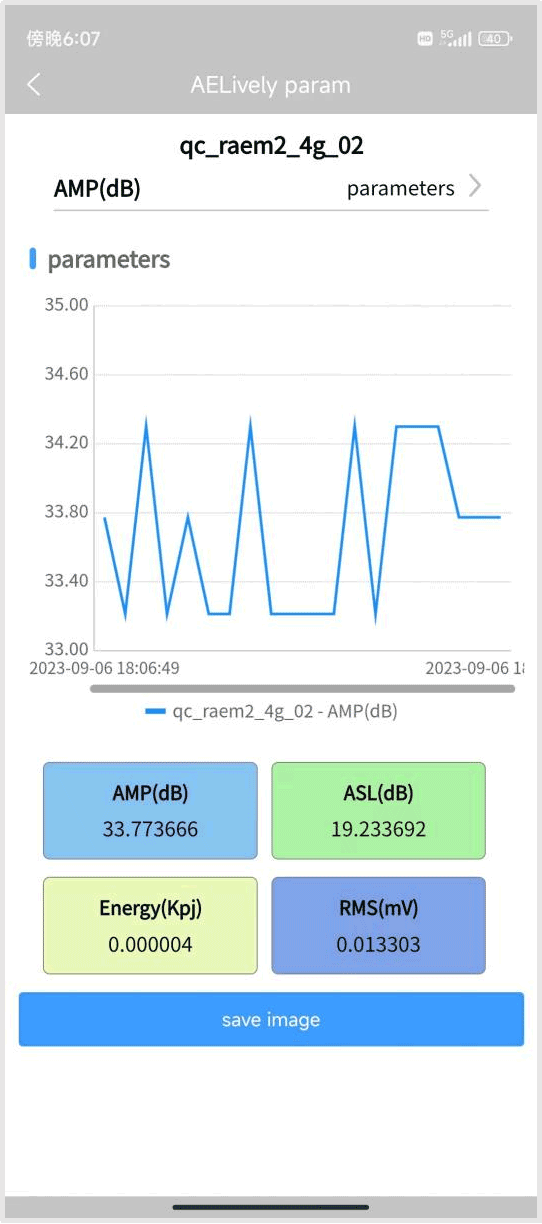
3) Smartphone App using Bluetooth for RAEM2
- Real-time parameters and waveform display
- Historical waveform and parameter query (parameters are amplitude, average signal level (ASL), energy, RMS; the display time accuracy is in minutes)
- Device control and configurations
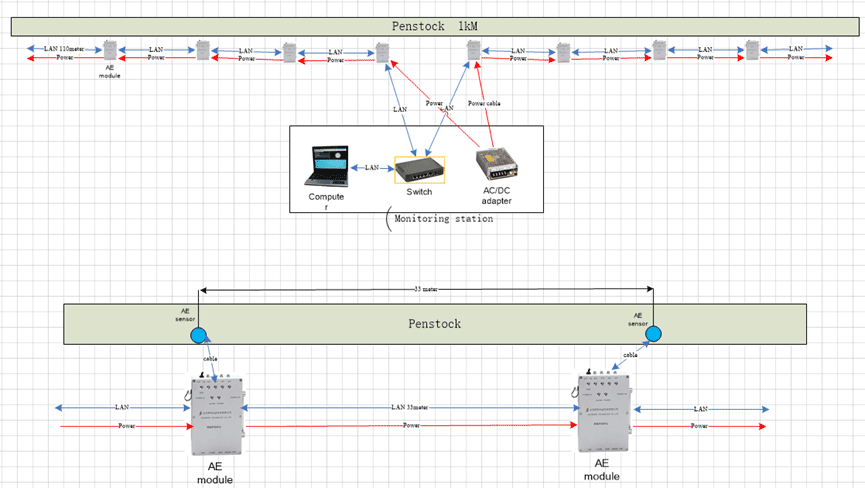
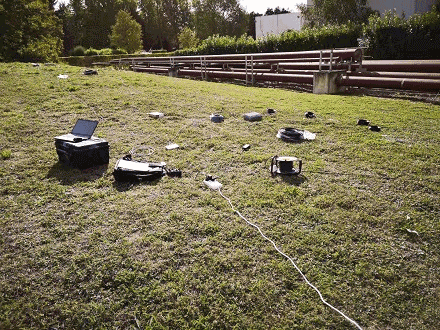
(1)Pipeline monitoring of CETIM power station in France
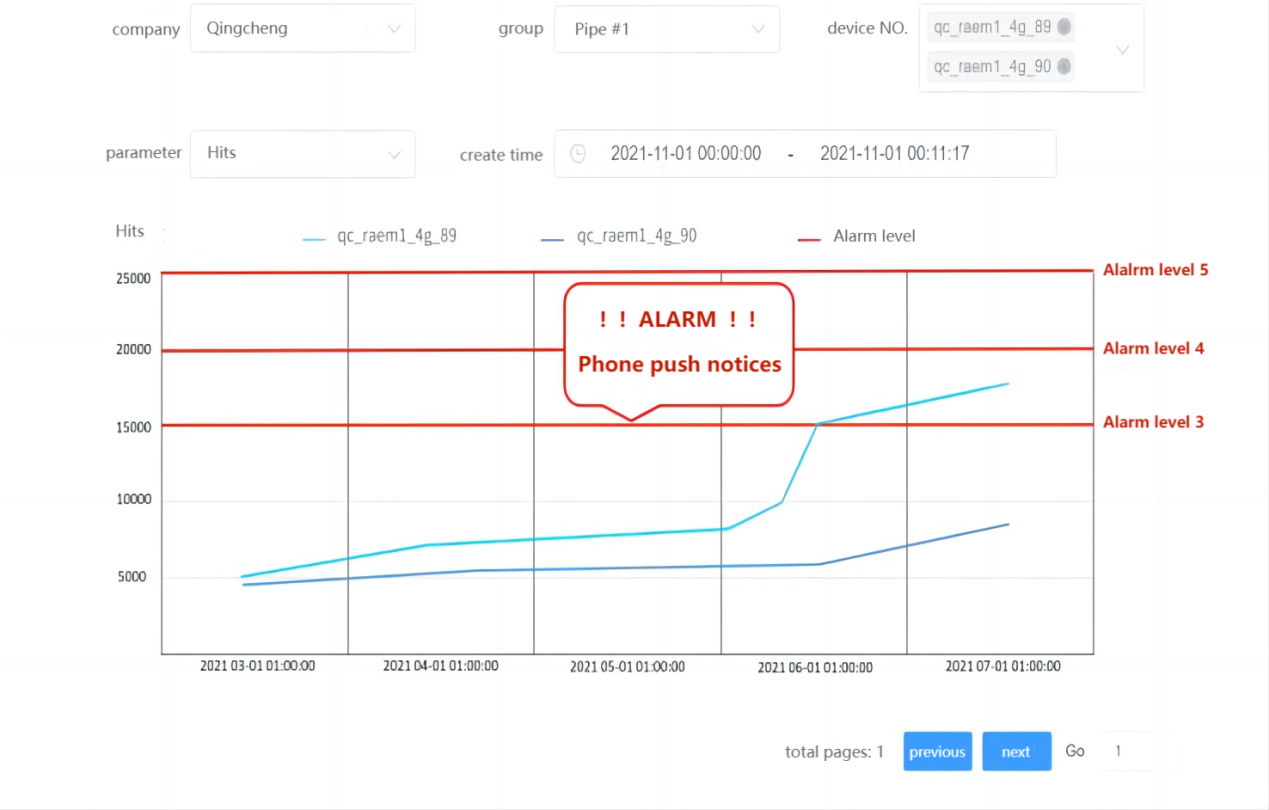
Due to the occurrence of accidental damages such as rockfalls in the pipelines of energy storage power stations, the arrangement of long-term unattended acoustic emission monitoring system performs linear source localization on long pipelines. The generated parameter rating results and other data are sent to the mobile phones to monitor in real-time whether the pipeline is leaking.
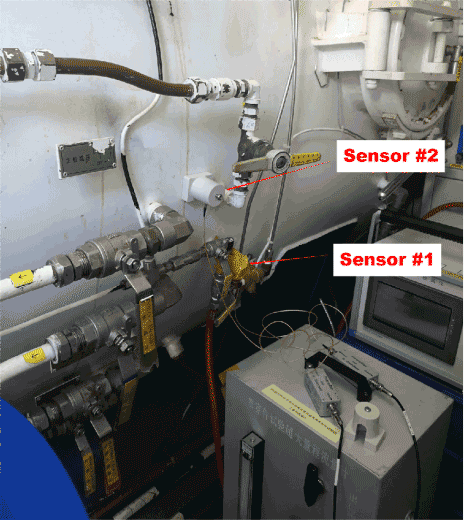
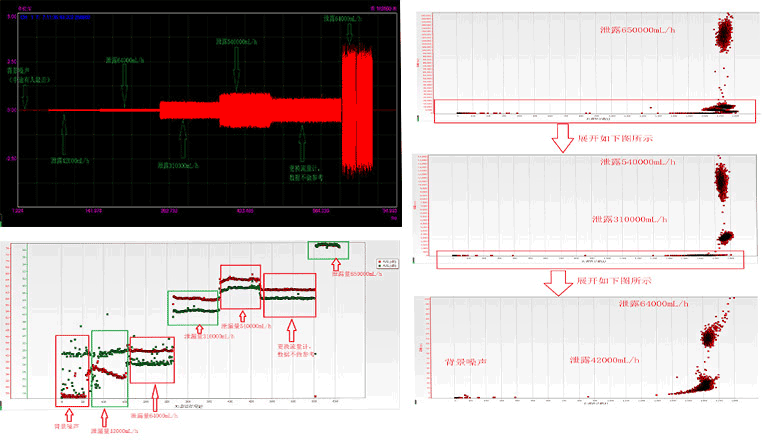
(2)Quantitative detection and monitoring of leakage in pipeline of a submersible company
| No. | Leak rate (mL/h) | Amp (dB) | Energy (Kpj) | RMS (mV) | ASL (dB) |
| 1 | 0 | 26.6-30 | 0-1 | 0.007-0.023 | 14-25 |
| 2 | 42000 | 46-51 | 9-22 | 0.055-0.085 | 33-37 |
| 3 | 64000 | 54-56 | 65-75 | 0.14-0.16 | 41-43 |
| 4 | 310000 | 68-72 | 2500-3200 | 0.95-1.05 | 57-58 |
| 5 | 540000 | 76-79 | 11000-13000 | 1.9-2.1 | 64-65 |
| 6 | 650000 | 85-90 | 120000-140000 | 6.5-7.5 | 74-76 |
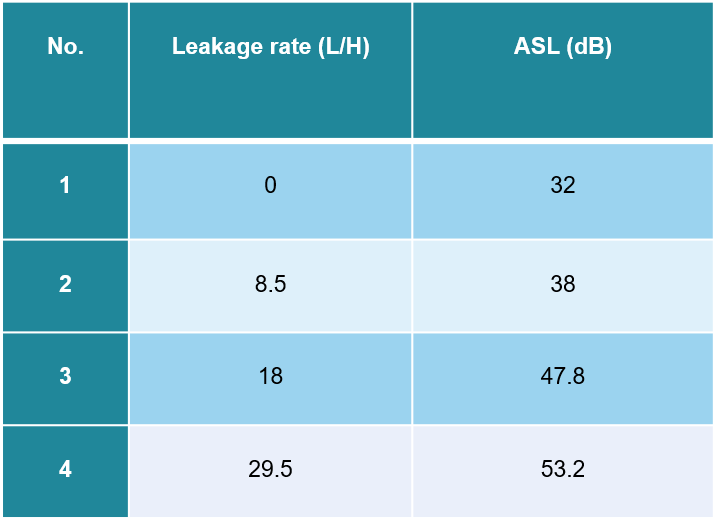
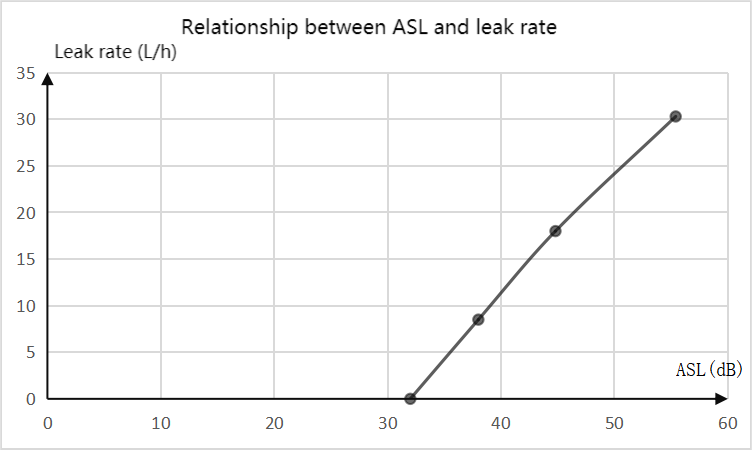
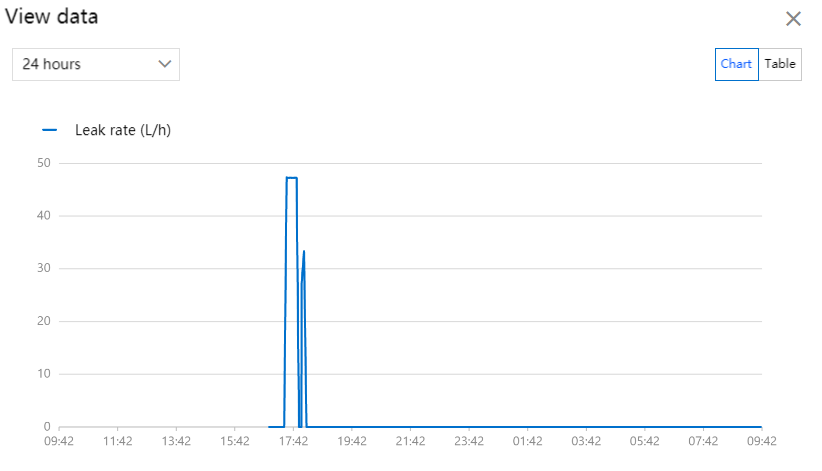
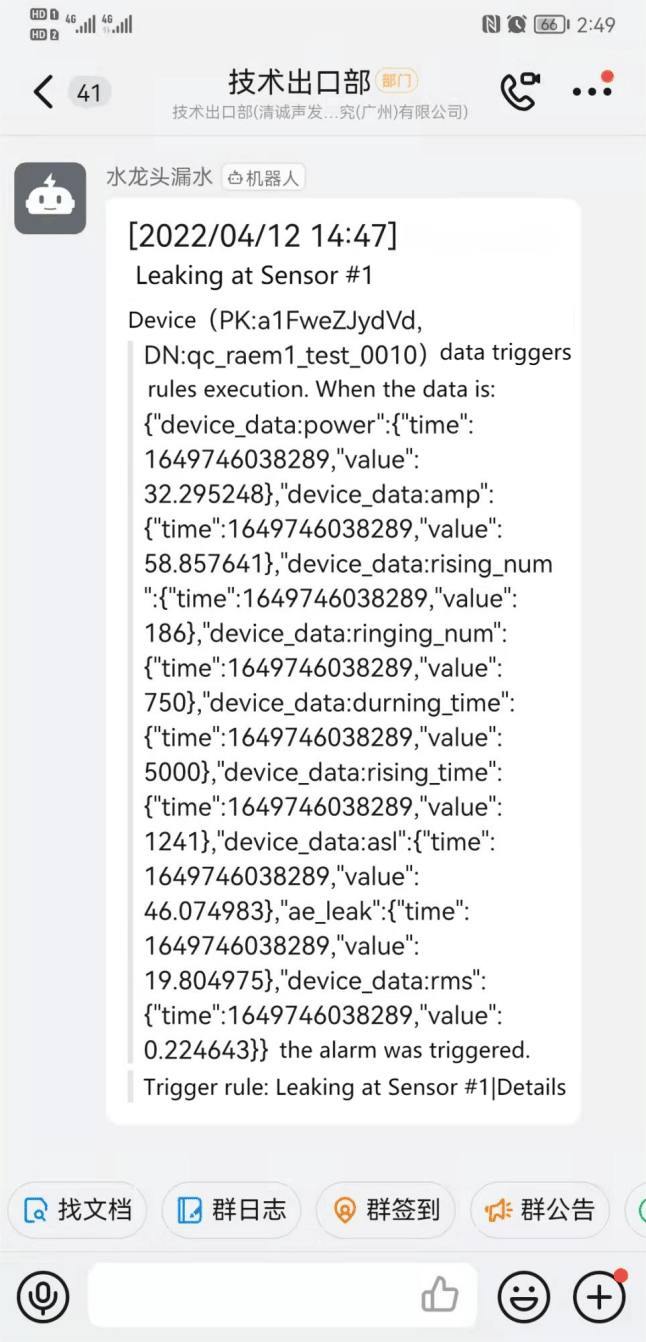
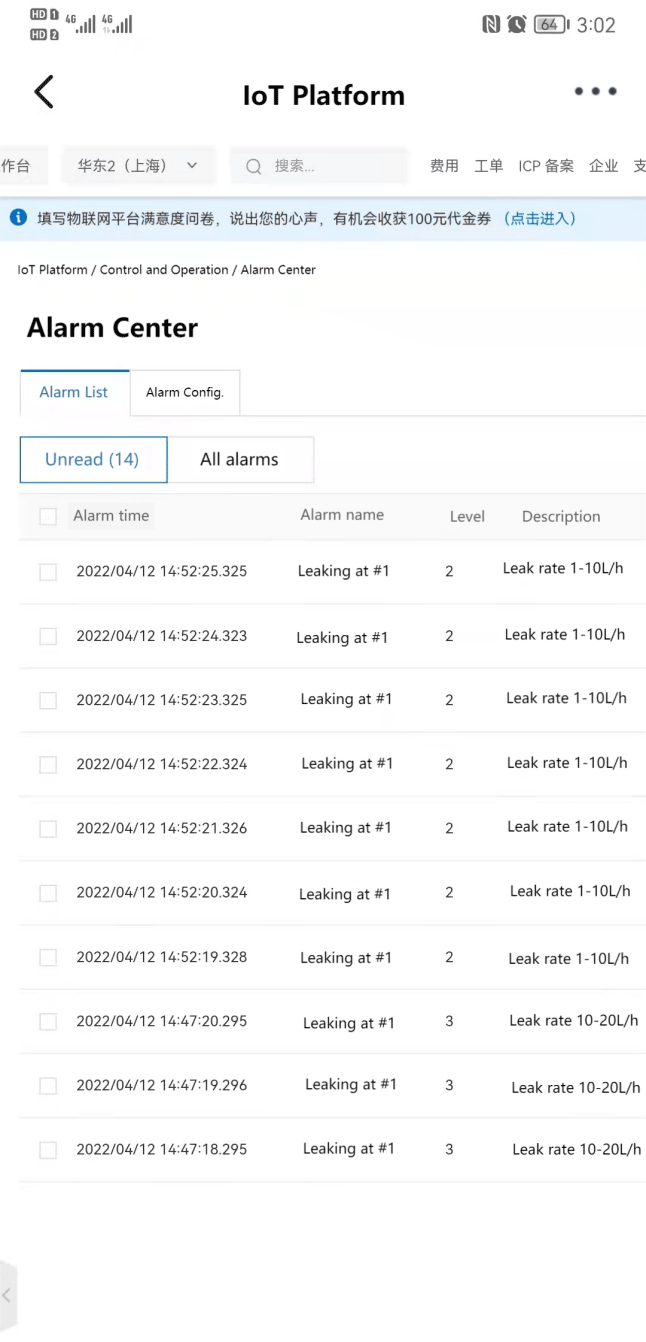
(3)Quantitative detection and monitoring of leakage in water pipes of a company
The relationship between leakage rate and ASL is shown in the following table: faucet leakage rate calibration.
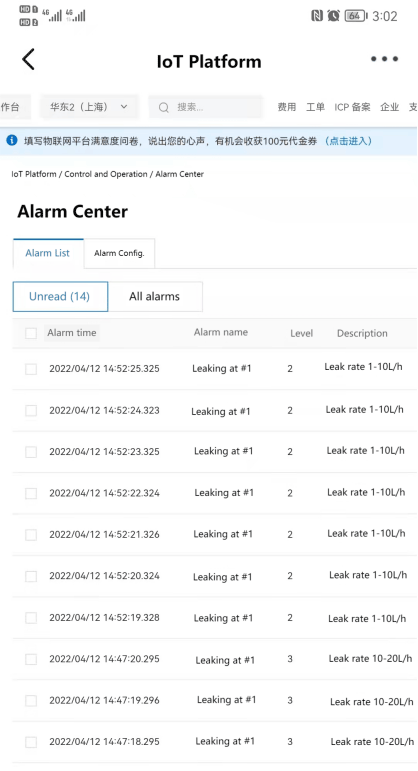
The instrument integrates built-in communication module, battery, it can upload the alarm signal to the cloud server, and push signals to the mobile phone
(4)Leak monitoring of pipeline experimental station in APC company
Contact Form
Please complete the form below to request your quote. We will be in contact as soon as possible.