
Valves Leakage Testing Experiment using Acoustic Emission Technology
Brief:Valves Leakage Testing Experiment using Acoustic Emission Technology. The IoT AE system RAEM1 could realize long-term unattended quantitative leakage monitoring.
1. Leakage monitoring of valve on the submersible
Background Introduction
- Monitoring object: Submersible with Ball valve and Pressure gauge
- Auxiliaries: Air compressor and flow meter
- Data acquisition equipment: SAEU3H AE acquisition system
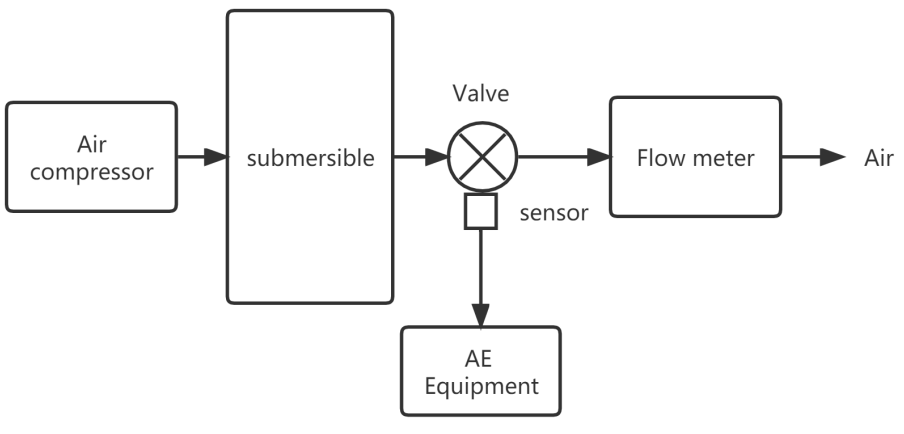
Detecting Procedures
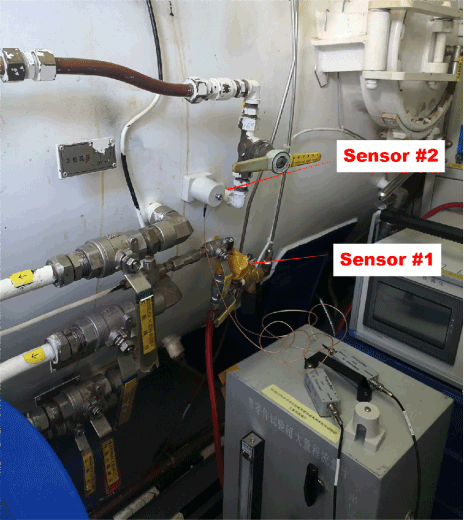
- Mounted AE sensors near the Ball valves and connected the AE system
- Kept the AE system sampling continuously
- Controlled the leakage rate by adjusting the Ball valve, which could be measured by Flow meter
Detecting Results
| No. | Leak rate (mL/h) | Amp (dB) | Energy (Kpj) | RMS (mV) | RMS (mV) |
| 1 | 0 | 26.6-30 | 0-1 | 0.007-0.023 | 14-25 |
| 2 | 42000 | 46-51 | 9-22 | 0.055-0.085 | 33-37 |
| 3 | 64000 | 54-56 | 65-75 | 0.14-0.16 | 41-43 |
| 4 | 310000 | 68-72 | 2500-3200 | 0.95-1.05 | 57-58 |
| 5 | 540000 | 76-79 | 11000-13000 | 1.9-2.1 | 64-65 |
| 6 | 650000 | 85-90 | 120000-140000 | 6.5-7.5 | 74-76 |
Fig. 1: Different leak rate and AE characteristic parameters
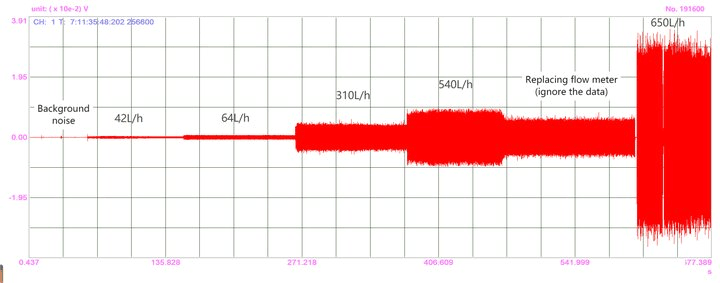
Fig. 2: Continuous AE waveform in time domain (different leakage rates at the same pressure)
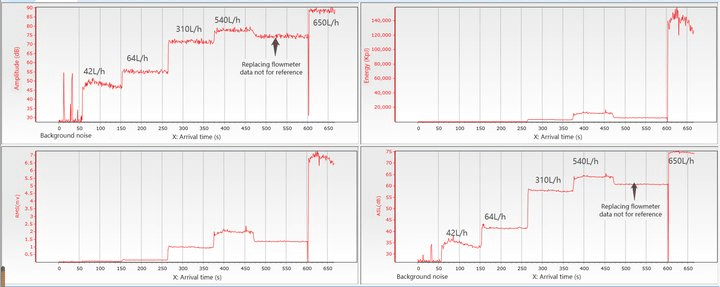
Fig. 3: Different AE parameters in time domain under different leakage rates
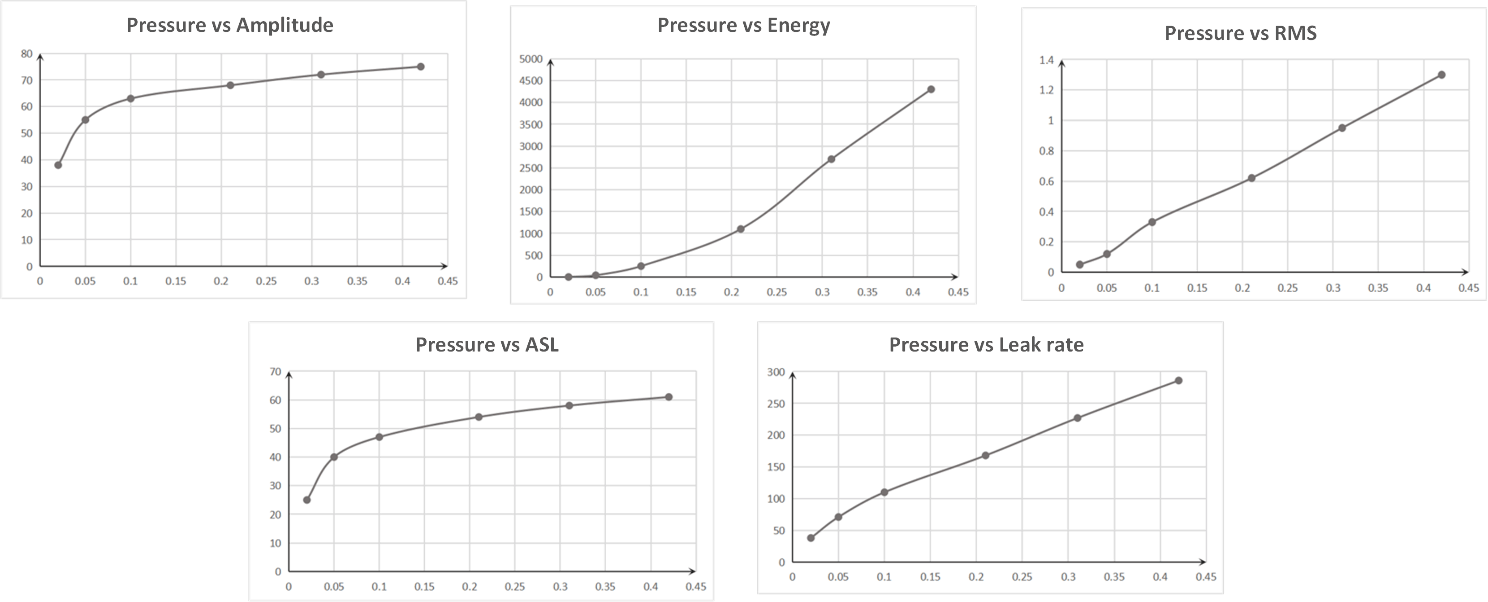
Fig. 4: Linear correlation diagrams between pressure and different AE parameters
Summary
- Leakage AE signals frequency was mainly about 15-70kHz;
- Leakage signal parameters were monotone increase or decrease along with the leakage rate;
- Energy, RMS and ASL could all be used as the criterion of leakage quantification, and ASL was the best.
- In valves and pipelines or tanks, the medium and pressure difference, size of the leakage source, position of sensor and other factors directly affect the AE signal characteristics, so we need to calibrate the AE monitoring system before using.
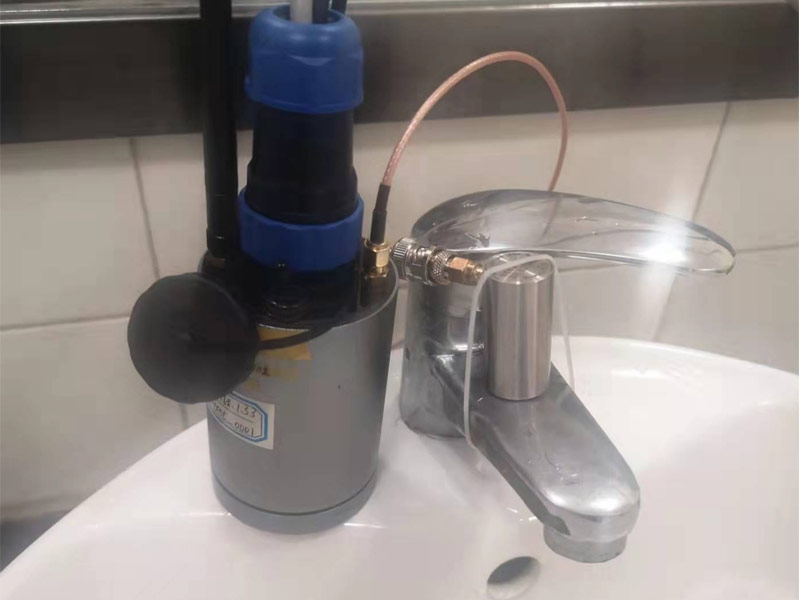
2. Leakage monitoring of water tap
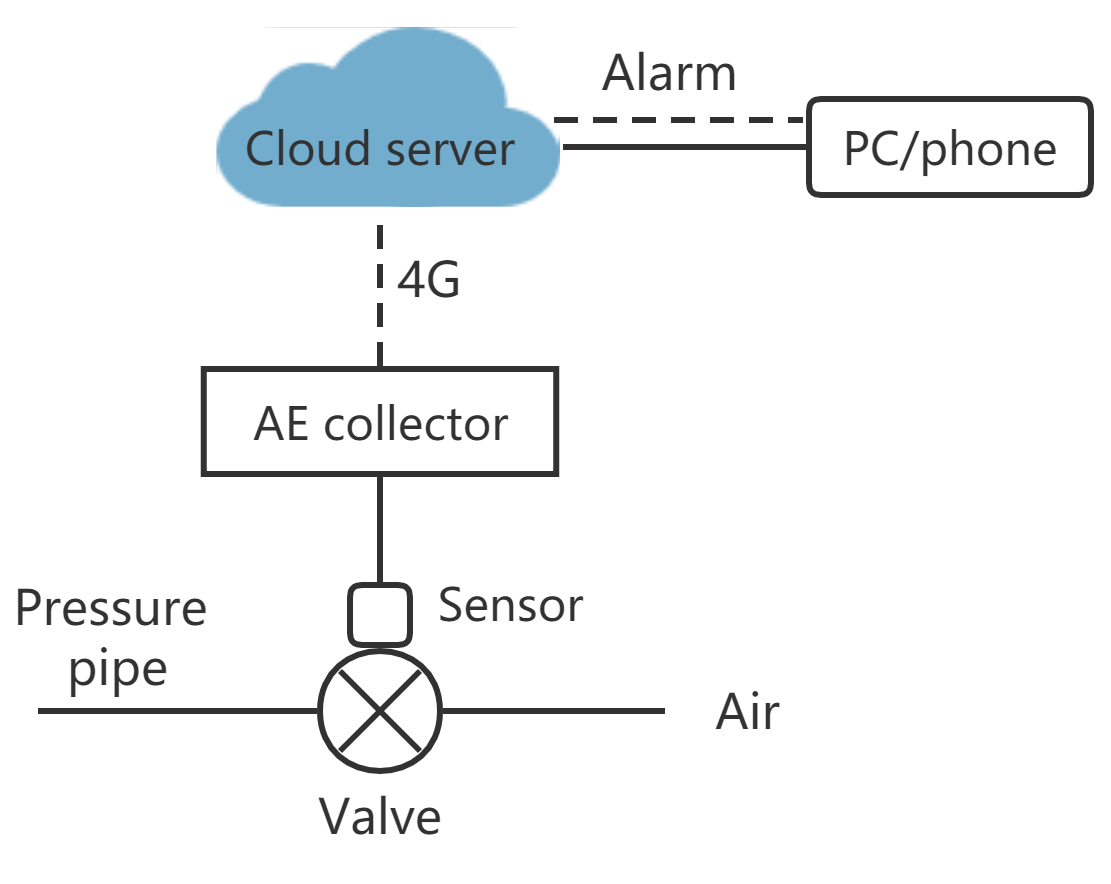
System Overview
As shown in the figure below, the faucet and water pipe are used to generate leaks, and the sensor is installed next to the faucet. RAEM1 acoustic wave (acoustic emission) monitoring system is an intelligent IoT AE equipment integrating signal acquisition, analysis, storage and communication. Using Linux system, its better safety and stability features make RAEM1 excellent in long term unattended operations. RAEM1 collects the signal, automatically determines whether it is leaked and the amount of leakage, and then transmits it to the cloud server through 4G. Users can log in to the cloud server to view real-time and historical parameters, and also set the alarm to be pushed to the mobile phone.
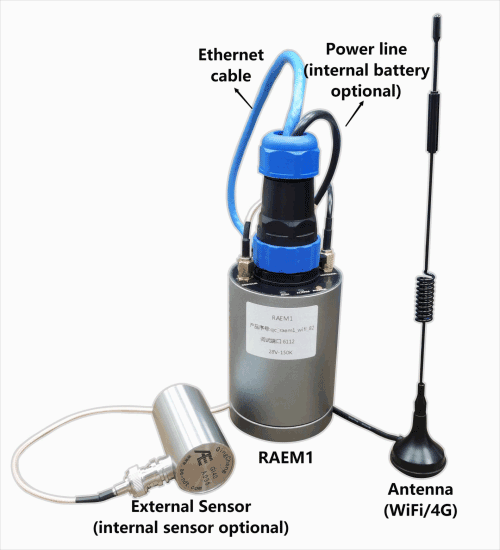
RAEM1 System Introduction
- Single channel
- Based on Linux system, 24/7 stable running
- 2M/16bits
- GI35 Sensor with preamplifier built-in
- Threshold trigger and time trigger
- Input bandwidth: 10-1000kHz
- Power supply: 12V DC internal/external
- Dimension: Φ62xH100 mm
- Communication: Ethernet/WIFI /4G/RS485 etc.
Monitoring Procedures
- AE sensor was installed next to the water tap.
- RAEM1 Remote Monitoring System was connected and tested.
- Sampling parameters were configured as follow:
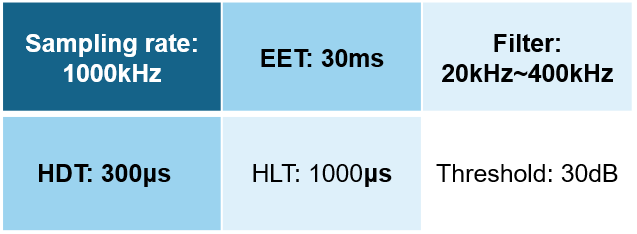
System Calibration
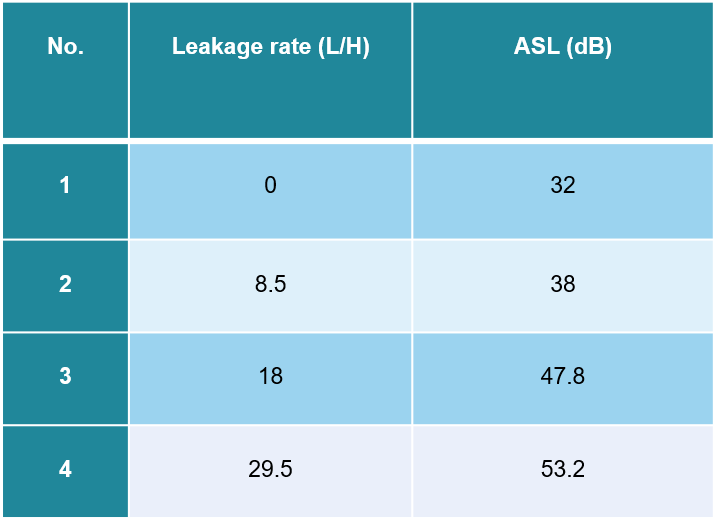
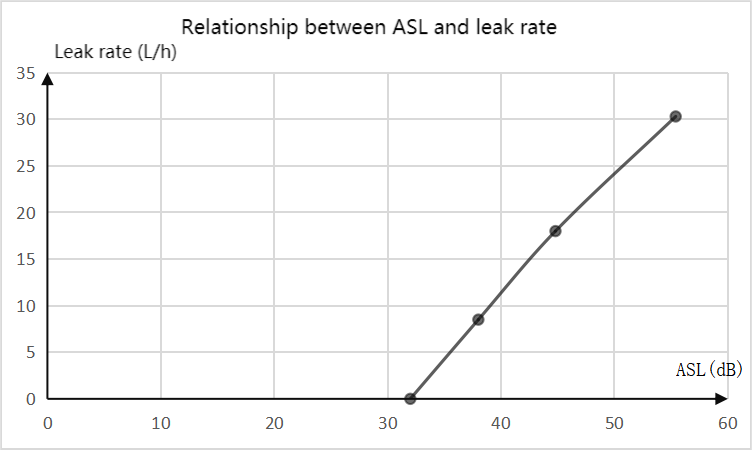
Turned on the water tap at different angles and measured the water with a measuring cup. The relationship between the leakage rate and ASL are shown in below:
-
According to the linear diagram, ASL and leakage rate basically have a straight slope. Let the leakage rate be:
L = k x ASL + b -
From the data of No. 2 and No. 3, we could get k =1.4 and b= -44.7. Therefore, the relationship between leakage rate and ASL is:
L = 1.4 x ASL - 44.7 - Input this formula in the monitoring system, the system could calculate the leakage rate automatically.
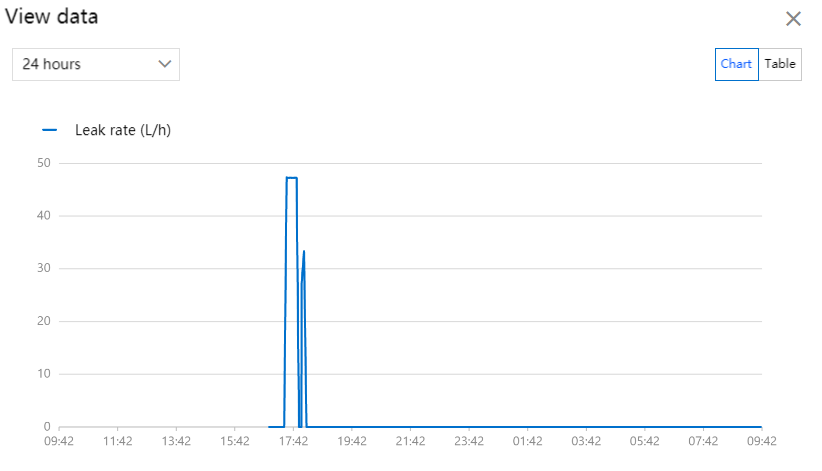
As shown in the chart, it could be clearly seen the time that leakage occurred and the corresponding leakage rate.
Alarm Setup
- Set alarm levels in the Cloud Platform.
-
The level rules of this simulating experiment were as below:
Alarm Leakage rate(L/H) level 1 1 ≤ L <10 level 2 10 ≤ L <20 level 3 20 ≤ L <30L level 4 30 ≤ L <100 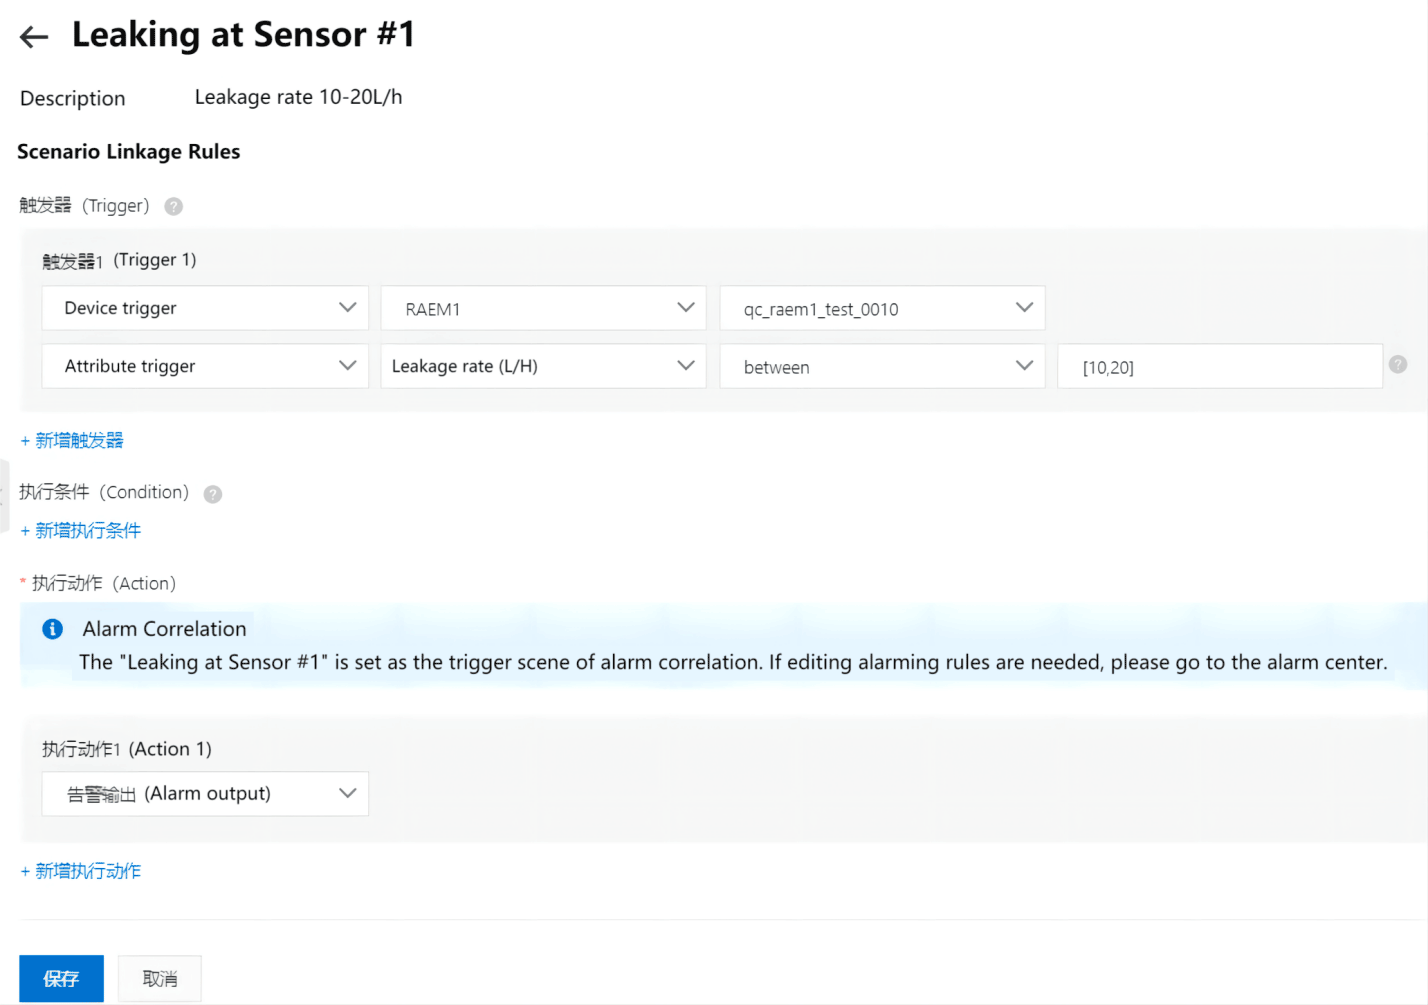
-
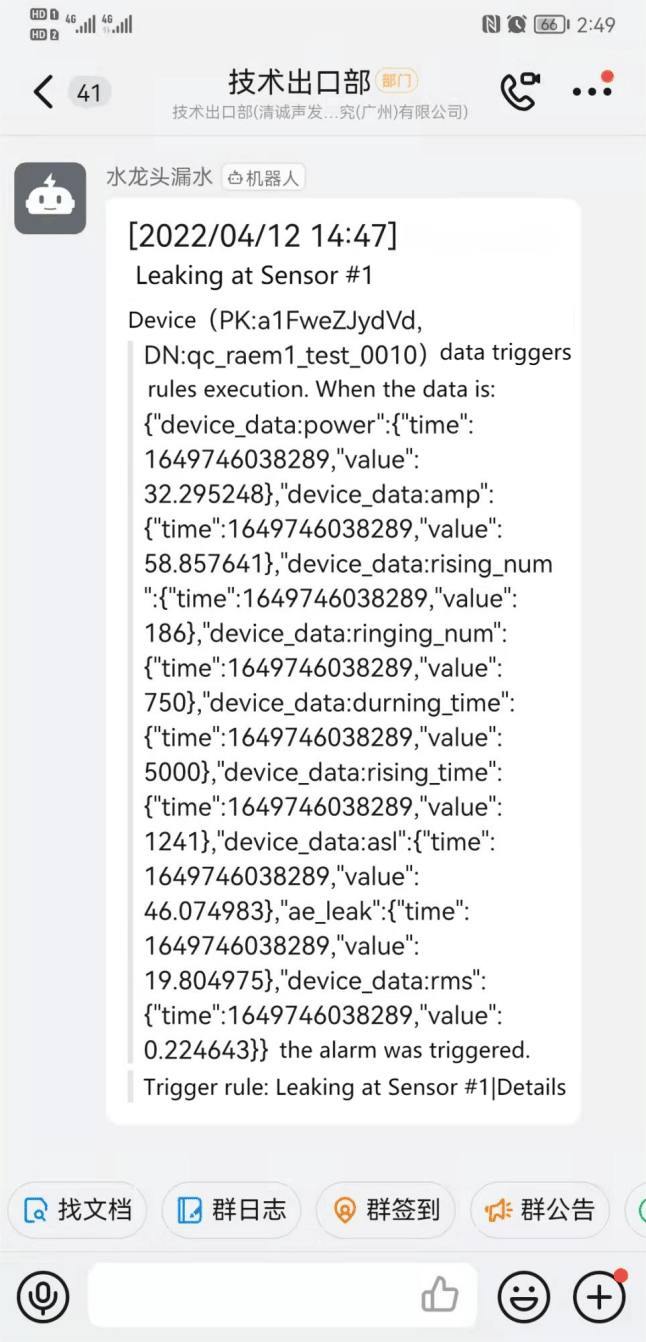
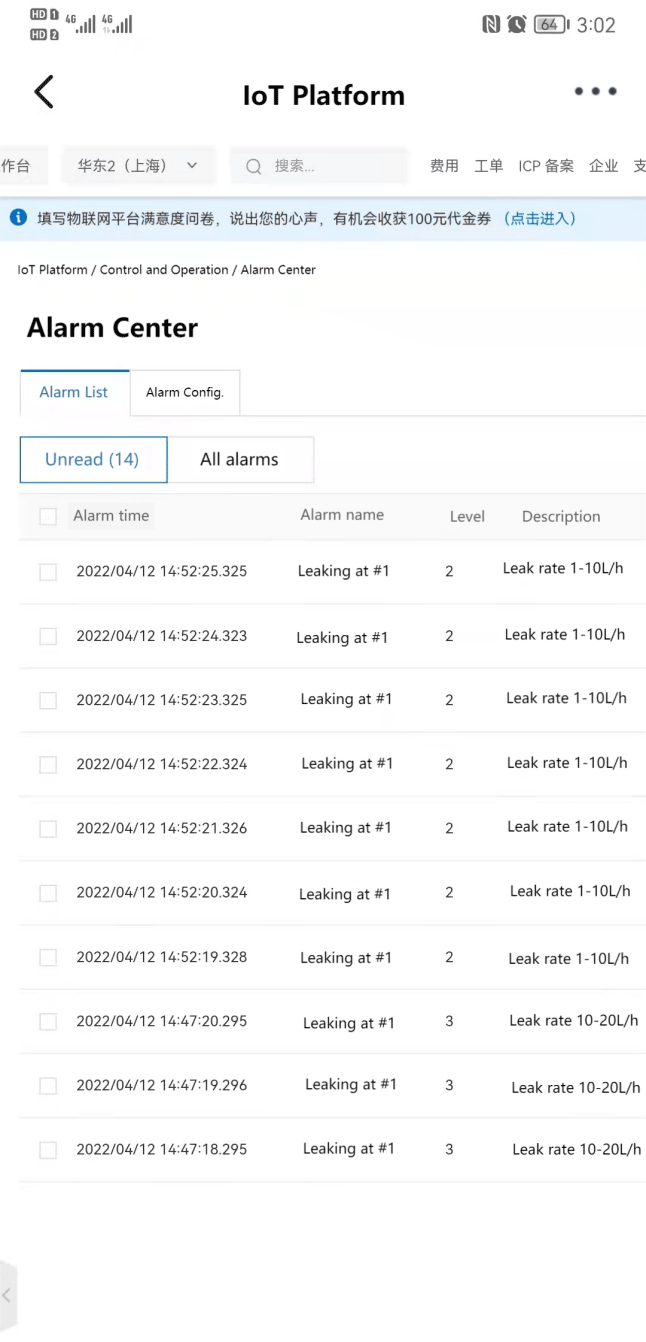
When the alarm condition was reached, the system send the alarm message or email to smart phone automatically and also shown in the cloud platform.
Conclusion
- The IoT AE system RAEM1 could realize long-term unattended quantitative leakage monitoring.
- Massive AE data could be processed and converted into simple and understandable leakage levels, so that user who do not understand Acoustic Emission could quickly get started.
- Data processing is centralized in the processor, only a small amount of data is output/uploaded, which can effectively reduce the requirements of data communicating speed and equipment costs.
- The advantages of long-term stable operation, automatic alarm, quantitative monitoring and low costs are meaningful to application of leakage monitoring.