
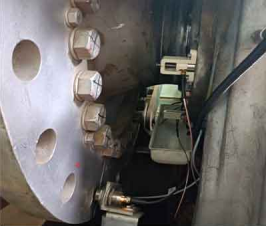
Low speed bearing monitoring
Brief:Low speed bearing monitoring. Basic test process of wind power bearing monitoring.
Low speed bearing monitoring

Basic test process of wind power bearing monitoring:
- Sensor, preamplifier, detector host and other hardware installation;
- By calibrating the sensitivity of each channel with artificial simulation source, the channel response is as consistent as possible.
- The signal conditions, such as signal conduction path and attenuation, were roughly evaluated by applying artificial simulation sources to each structural part;
- When positioning analysis is required, error analysis should be performed with known simulated sources and positioning sources
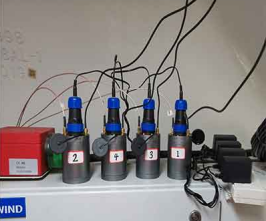
- Instrument sensor self-calibration test (used to determine instrument status during monitoring, especially sensors
- The threshold value is determined by testing noise;
- Long time big data acquisition, record operation, load, environmental conditions (weather, maintenance, etc.);
- Before the instrument is disassembled, the sensitivity of each channel is calibrated by the simulation source again, and the differences are recorded to be taken into account when analyzing the data.
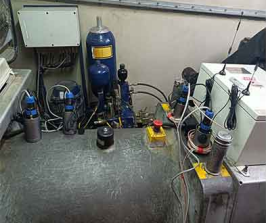
Scene operation diagram
Basic method of data processing (single data) :
- Longitudinal comparison of acoustic emission data combined with load conditions of a single monitoring object (data selected by the first test in the early morning of March 27 and April 5);
- According to the trend and distribution law of the parameter history chart, the structure of the fault point is judged according to the analysis of bearing fault characteristics.
- The correlation of parameters can be roughly judged to be signal type and type, such as amplitude -ASL, duration - rise time, ringing count - rise count, amplitude - energy, etc. It can be roughly judged to be crack or friction signal.
- Comparison analysis and classification of typical time domain signals and their spectrum;
- Abnormal characteristic parameters and waveform signal correlation analysis, conformance identification, such as high energy and high amplitude signal is not necessarily crack signal, mainly to do the verification of the third article (parameter analysis called waveform analysis efficiency);
- Time difference positioning analysis (uniform structural parts have good effect, high accuracy, but high requirements for channel consistency).
Check back the related solution page here.
Acoustic Wave (Acoustic Emission) Monitoring of Rotating Device