Acoustic Emission Testing for Vessels & Tanks Monitoring
Aboveground Storage Tank (AST) Bottom Plate Corrosion Detection/ Monitoring
1. Why AE Monitoring Is Needed
Storage tanks, pressure vessels and boilers are required to take regular inspections and testing to ensure the safety of continuous operations and the integrity of the vessels in case of corrosion, cracks and leaks.
The national and industrial standards of the pressure vessels and storage tanks inspection include some non-destructive testing methods, for example, radiographic testing, ultrasonic testing, eddy current testing and magnetic particle testing. However, another NDT technology, acoustic emission testing (AET) has unique advantages of non-stop operations or no need to drain or open the vessels, which makes the AET a faster and cost-effective technology for tank inspection, storage tank monitoring and pressure vessel detection and monitoring.
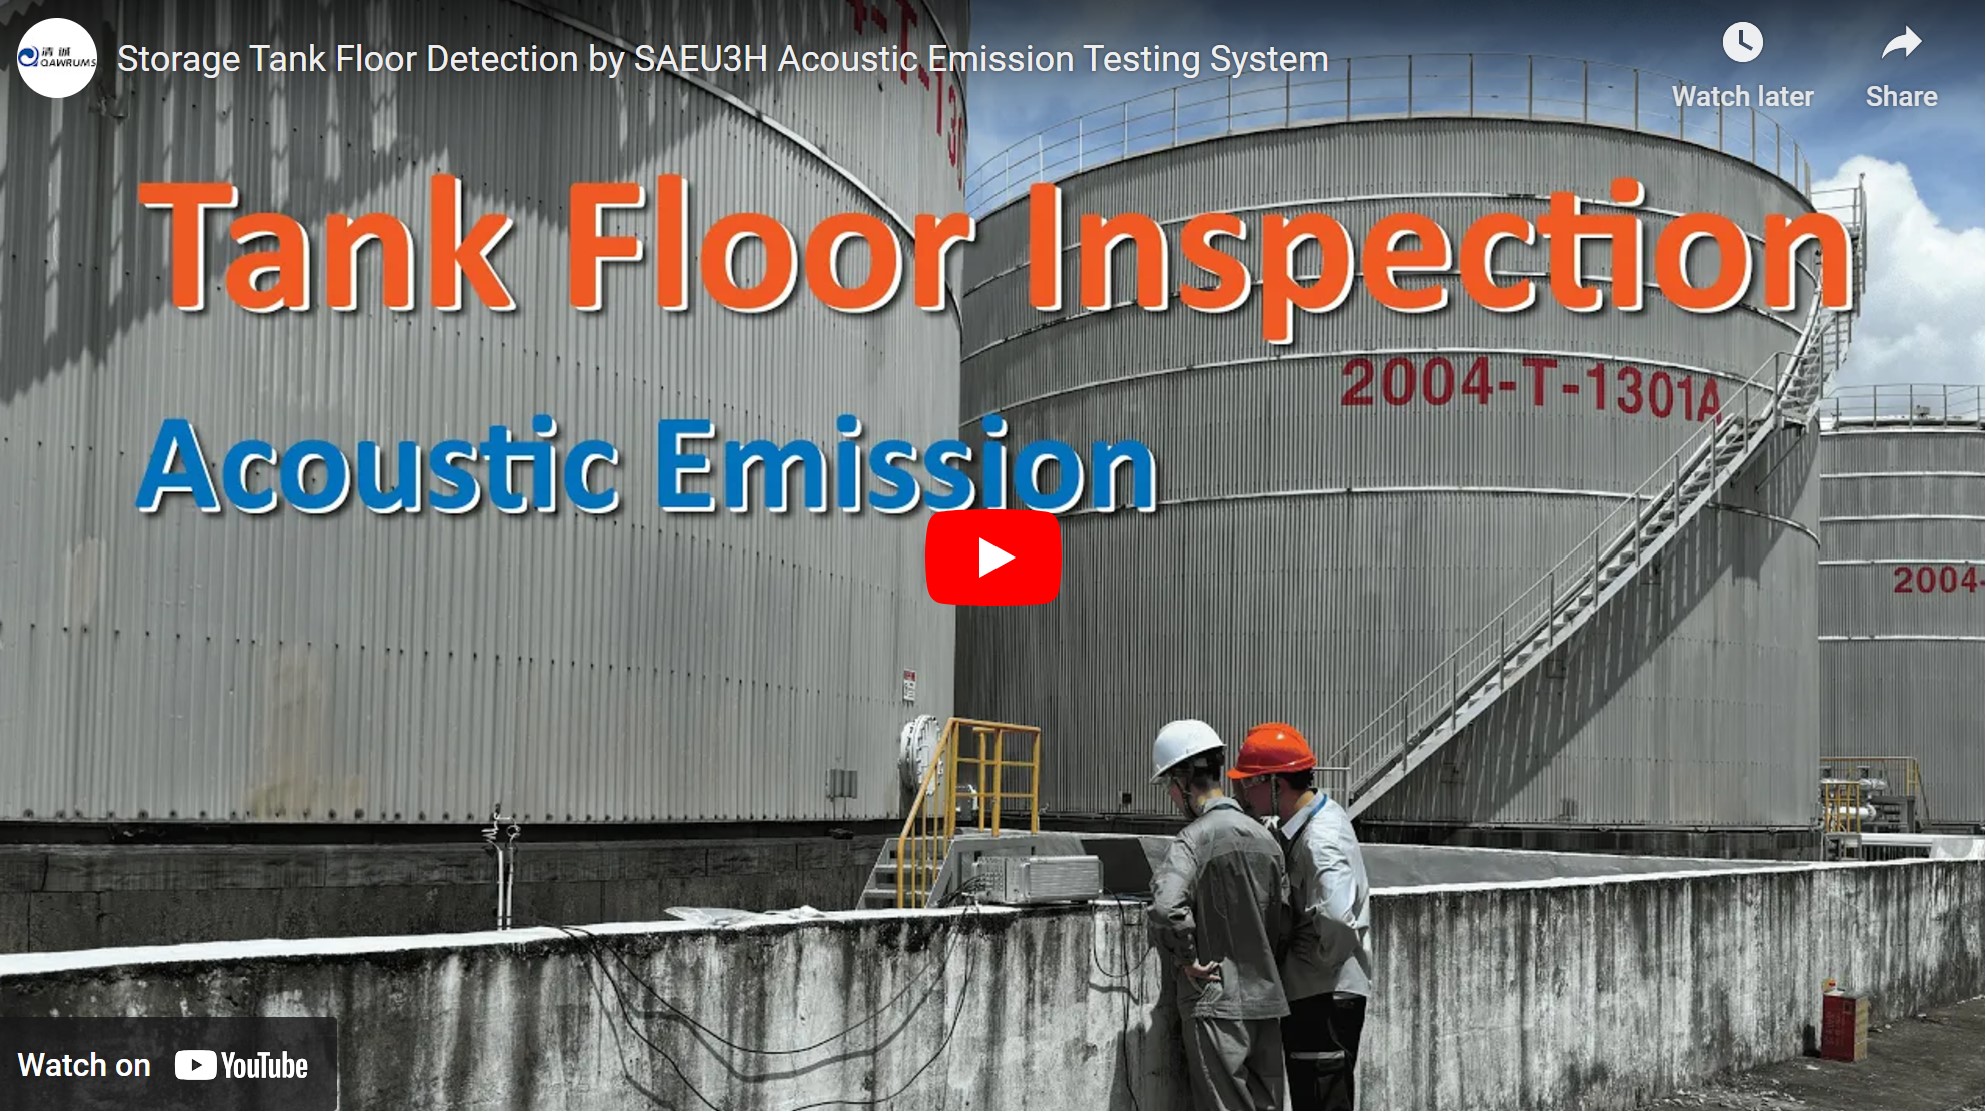
2. Storage Tank Floor Corrosion Detection On-site Video
3. Acoustic Emission Monitoring Principle
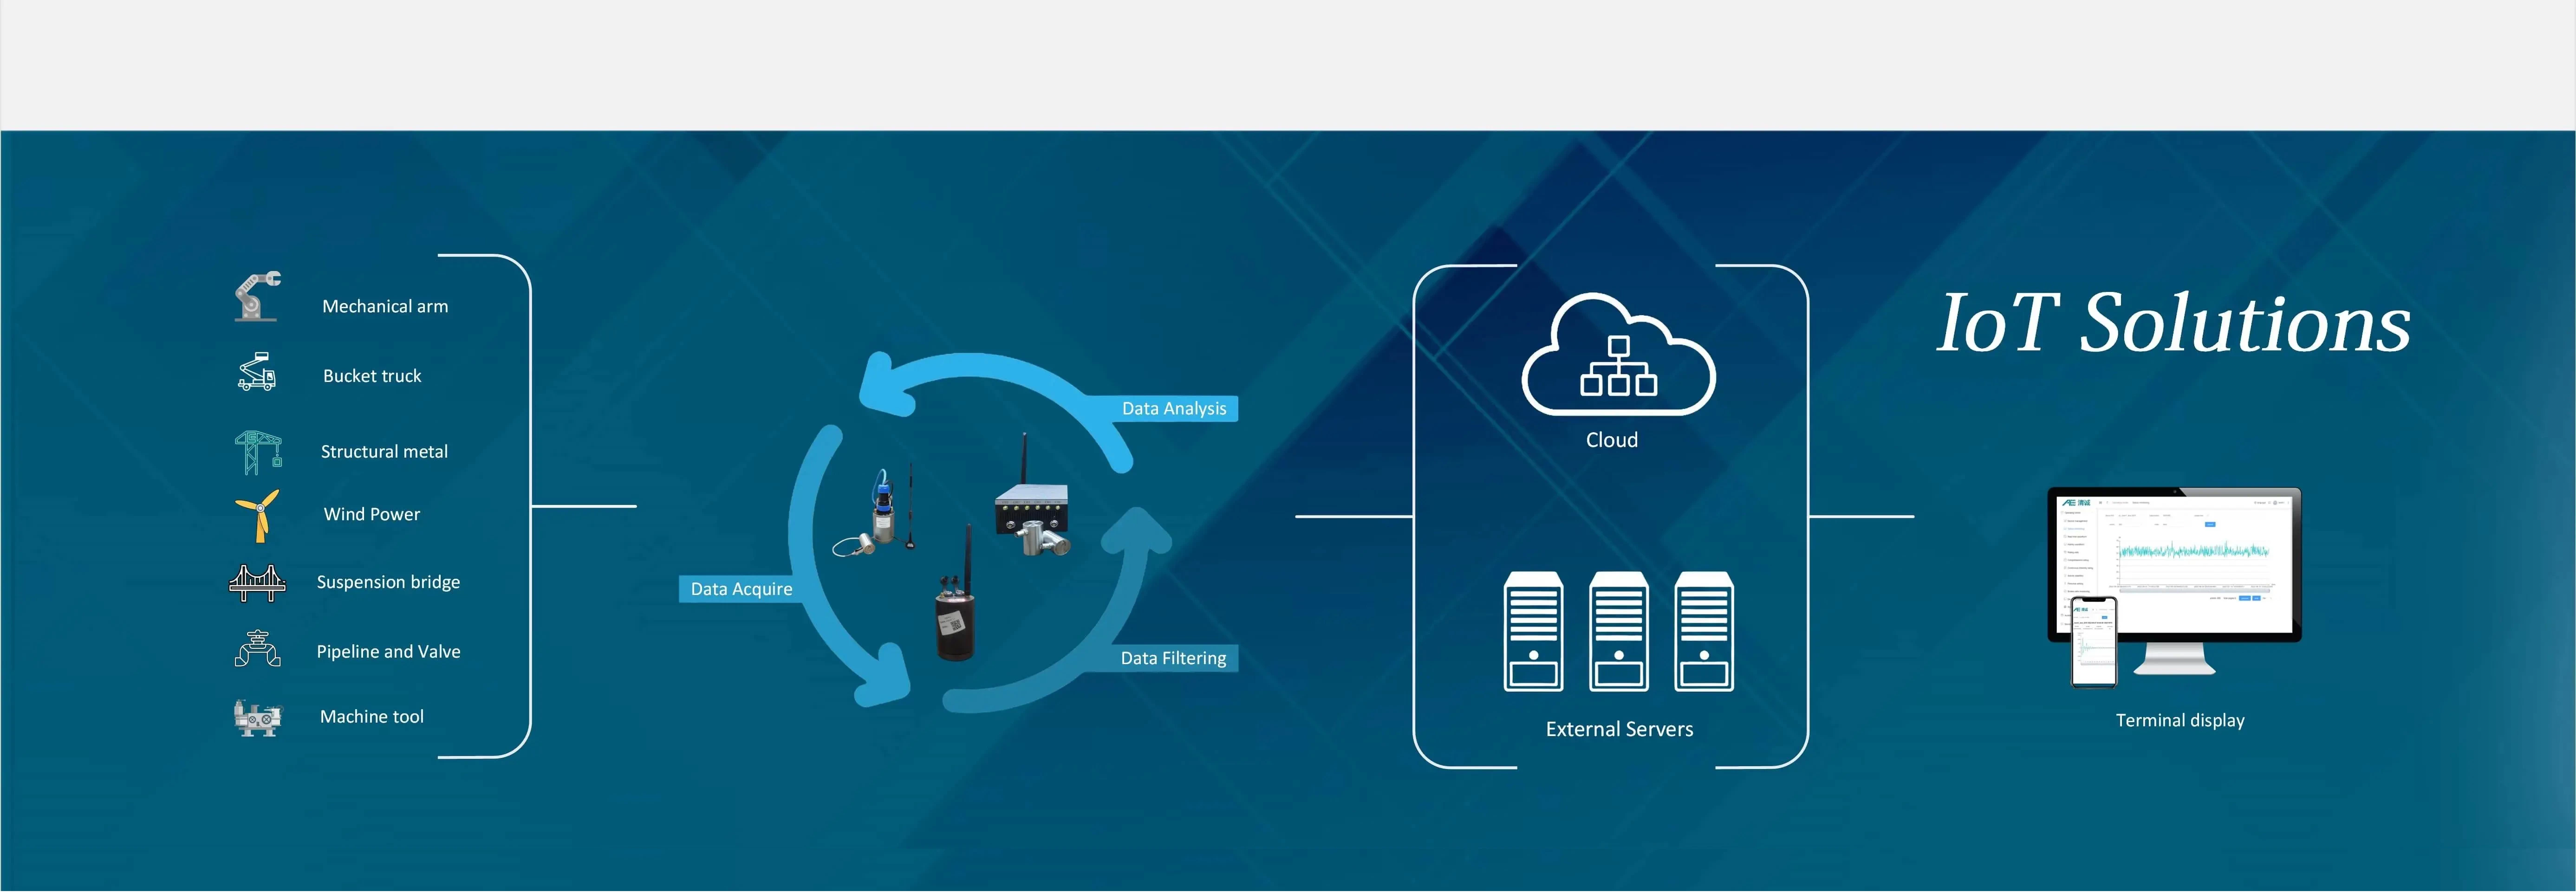
Corrosion in atmospheric pressure storage tanks, particularly on the bottom plate, leads to leakage, seepage, and thinning. This degradation generates acoustic signals that travel through the tank's medium or bottom plate. The sensor array mounted on the tank wall passively detects these signals, which are then collected, analyzed, and transmitted to a PC/server/cloud platform. The data is processed using SWAE software, which creates a corrosion map of the bottom plate. This map allows users to assess the corrosion's location, intensity, and activity, and apply cluster analysis to evaluate and classify the corrosion levels.
Acoustic Emission (AE) technology, in accordance with standards such as JB/T 10764-2023 and ISO 24489, provides a reliable method for detecting corrosion in newly constructed and in-service vertical tanks containing gas or liquid media, with operating pressures at or below 0.1 MPa. AE monitoring offers an effective and non-destructive way to evaluate tank condition and identify potential issues before they lead to more severe damage.
3.1 Compared with other NDT Technologies
| Technology | Area | Pros and Cons |
| Acoustic emission testing | Bottom plate, tank body |
Non-stop Online Detection Allows real-time detection without production shutdown; efficient, low-cost, and provides clear, reliable results. |
| Magnetic flux leakage testing | tank wall |
No Surface Grinding Required However, surface debris such as iron chips or oxide scale may cause false indications. |
| Ultrasonic Testing with Crawler | tank wall |
No Scaffolding Needed Limited by tank wall structures (e.g., wind girders may obstruct access). |
| X-ray testing | tank wall weld |
Clear Defect Indications Subject to structural constraints—requires personnel to enter the tank for operation. |
| Infrared imaging | tank body |
Fast Detection with Visual Results Offers quick inspection and intuitive outcomes; however, image contrast is low, and the method is costly. |
| Eddy current testing | tank wall |
Easy Operation and High Speed Suitable only for surface and near-surface defects in metals, not for deep internal flaws. |
| Phase-controlled array testing | tank wall weld |
High Detection Rate for Thin-wall Weld Seams Requires grinding of the inspection area and scaffolding for work at height. |
3.2 AE Technical Advantages
- Real-time monitoring
- No shutdown required
- Early fault detection
- Cost-effective inspection
-Bottom-Plate-Corrosion-Detection-Monitoring_1.png )
3.3 Data Deep Analysis
SWAE analysis software provides various graphic views to assist in in-depth research on tank corrosion, such as location maps, correlation graphs, data tables, frequency domain FFT views, etc. It is suitable for SAEU3H benchtop multi-channel AE system and RAEM1-6 multi-channel remote unattended monitoring system, and can perform data collection, display and post analysis.
-Bottom-Plate-Corrosion-Detection-Monitoring_3.png )
-Bottom-Plate-Corrosion-Detection-Monitoring_4.png )
4. AE Monitoring System Configuration
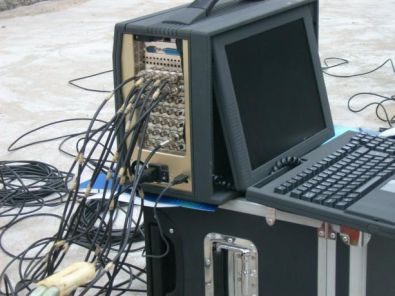
1) Data Acquisition Systems
System Composition:
- Acoustic emission sensor with built-in preamp
- Multi-channel acoustic emission instrument (SAEU3H)
- Computer with software (SWAE)
-Bottom-Plate-Corrosion-Detection-Monitoring_5.png )
The SAEU3H Multi-Channel Integrated Acoustic Emission Testing System is a data acquisition unit (DAQ). The complete system should work with AE sensor, preamp and the SWAE software on a Windows based computer. The SAEU3H contains multiple AE boards, each with four independent AE channels. Depending on requirements of channels, the system can be configured by selecting different chassis and the number of AE boards to form the suitable AE systems. Multiple chassis can be cascaded to build large acoustic emission systems.
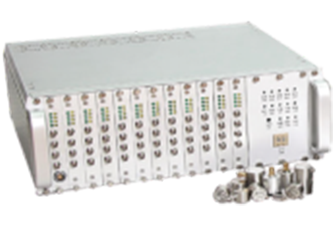 48-channel System |
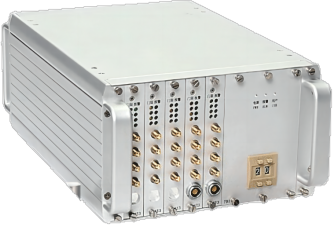 20-channel System |
 4-channel System |
-Bottom-Plate-Corrosion-Detection-Monitoring_6.png )
System Composition:
- Acoustic emission sensors
- Acoustic emission acquisition instrument (signal acquisition and analysis and communication)
- Cloud (cloud server IoT platform/LAN server/computer/mobile phone, etc.)
- Terminals (mobile phone, PC, etc.)
-Bottom-Plate-Corrosion-Detection-Monitoring_7.png )
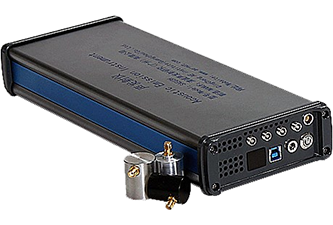
The RAEM1-6 is a multi-channel intelligent IoT acoustic emission monitoring system that integrates automated signal acquisition, processing and analysis, clock synchronization, and wired/wireless communication. With high reliability for 24/7 continuous standalone operation and wireless transmission capability, it is suitable for long term, continuous, unattended automatic monitoring applications, such as structural health monitoring of bridges and corrosion monitoring of storage tanks.
c.Data Acquisition System Specs
| SAEU3H | RAEM1-6 | |
| Channel | 4 channels per AE board. There are chassis for 4/20/48 channels. Cascade chassis for 128 channels. | Flexible to order any number of channels. Each chassis can install up to 6 channels. Cascade chassis for unlimited channels |
| Sample Mode | Threshold | Threshold/time/continuous |
| Sample Rate | Max 10MS/s per channel, 16-bit | Max 2MS/s per channel, 16-bit |
| System Noise | <15dB (no load) | <30dB |
| Dynamic Range | 85dB | 70dB |
| Input Frequency | 1kHz to 2.5MHz (-3dB bandwidth) | 10kHz to 800kHz (-3dB, pass-through) |
| Analog Filter | High-pass filter: 20kHz, 100kHz, 400kHz; Low-pass filter: 100kHz, 400kHz, 1200kHz; any combination of the two filters to be set in the software; each channel is independent |
Software selectable (kHz): 20-100kHz/ 20-400kHz/ 70-100kHz/ 70-400kHz/ Pass-through/ Bypassed |
| Digital Filter | From 1KHz-2.5MHz frequency range, any value can be set as the pass-through, high-pass, low-pass, band-pass filter | Set any value in between 0 to 1000 kHz frequency range as pass-through/ high-pass/ low-pass/ band-pass filter |
| Phantom Power Output to Preamp | 28V or 5V or 0V phantom power through coaxial cables to the preamplifier in software | Hardware fixed only one type of phantom power to preamp: 28V or 12V or 5V |
| Data Output | Waveform, parameters | Waveform, parameters, parameter ratings |
| AE Featured Parameters | Arrival time, amplitude, counts, duration, energy, rise counts, rise time, RMS, ASL, 12 external parametric, center frequency, peak frequency, 5 partial powers | Arrival time, amplitude, counts, duration, energy, rise counts, rise time, RMS, ASL, 12 external parametric, center frequency, peak frequency, 5 partial powers |
| Internal Capacity | 1GB per AE board | / |
| Transmission | USB3.0 | Ethernet, additional WiFi/4G |
| External Input | Each AE board supports 4 external inputs; Up 12 external inputs in a system. Input range from ±10V. Maximum sample rate of 1MHz; able to external input trigger | Up to 4 external inputs; input range from ±10V. Maximum sample rate of 1MHz; able to external input trigger |
| Alarm Output | Switches or lights can be used to output alarm signals | 2 channels |
| Temperature | -10℃~45℃ | -20~60℃ |
| Input Power | 100~240VAC, 50-60Hz (4-channel chassis: 12VDC) | 12VDC |
| Dimension (LxWxH, mm) |
4-channel chassis: 320 x 125 x 50 20-channel chassis: 363 x 225 x 150 48-channel chassis: 368 x 363 x 150 |
232 × 125 × 52 |
| Weight (kg) | 1.3 / 3.7 / 5.16 | 1.25 |
2) AE Sensors
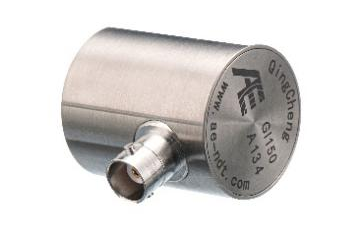
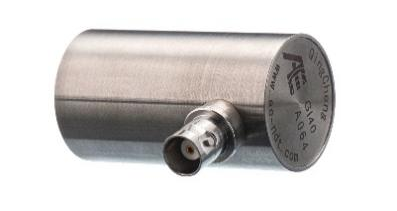
| GI150 | GI40 | |
 |
 |
|
| Resonant Frequency | 150KHz | 40KHz |
| Frequency Range | 60KHz~400KHz | 15KHz~70KHz |
| Sensitivity | >75dB | >75dB |
| Built-in Preamp | 40dB28V | 40dB28V |
| Connector | BNC | BNC |
| Protection Degree | IP62 | IP62 |
| Temperature | -20℃~50℃ | -20℃~50℃ |
| Dimension(ΦxH, mm) | Φ30×36.5 | Φ30×57 |
| Target Defects | Cracks | Corrosion, leak |
3)SWAE Software
SWAE acoustic emission system software is a combination of real-time acquisition and analysis and post-analysis software. It supports two types of AE product series, SAEU3H instrument and RAEM1 series (RAEM1 and RAEM1-6) respectively. SWAE can perform data acquisition, playback and analysis on the equipment. Its main functions are location map, correlation graphs, data table, and frequency domain waveform map, etc.
-Bottom-Plate-Corrosion-Detection-Monitoring_8.png)
Xingsan Joint Station Case: online detection of AE from storage tanks
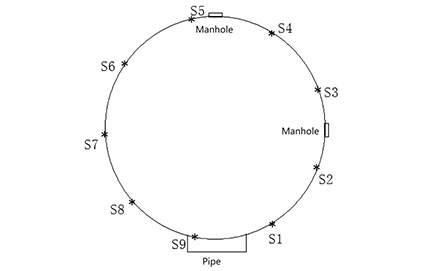
For example, nine sensors were evenly arranged around the outer wall about 50 cm above the bottom plate, avoiding discontinuous locations such as pipes and manholes as much as possible, with a horizontal spacing of about 7.8 meters.
-Bottom-Plate-Corrosion-Detection-Monitoring_9.png)
Fig 1.1 Sensor Arrangement
Acoustic emission testing of the tank for 2 hours:
-Bottom-Plate-Corrosion-Detection-Monitoring_10.png)
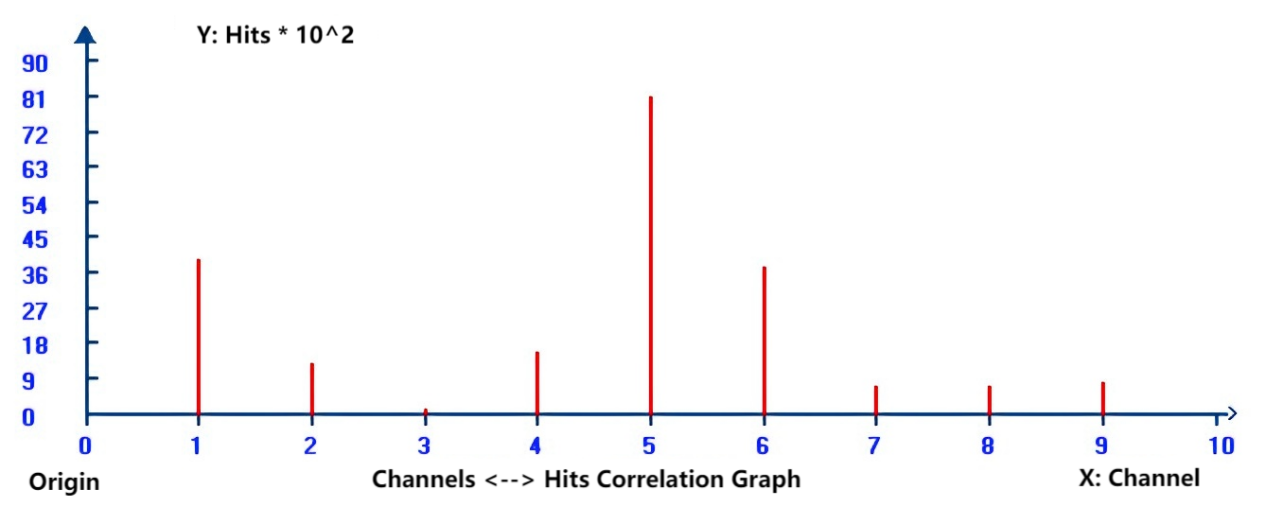
Fig 1.2 Tank #2 Channel - Hits Correlation Graph
-Bottom-Plate-Corrosion-Detection-Monitoring_11.png)
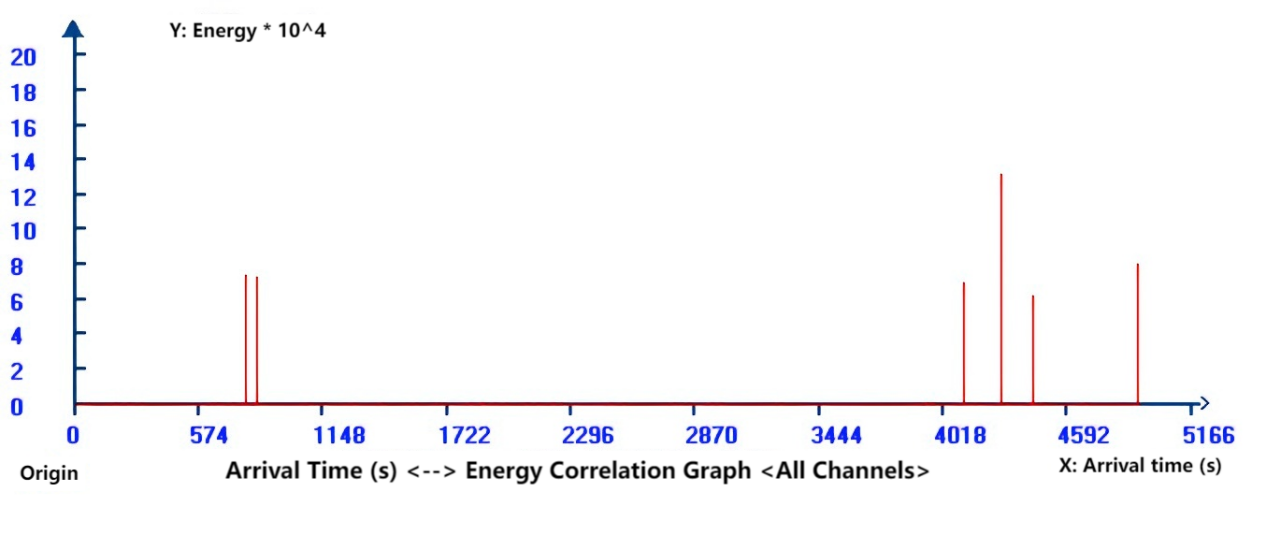
Fig 1.3 Tank #2 Arrival time - Energy Correlation Graph
-Bottom-Plate-Corrosion-Detection-Monitoring_12.png)
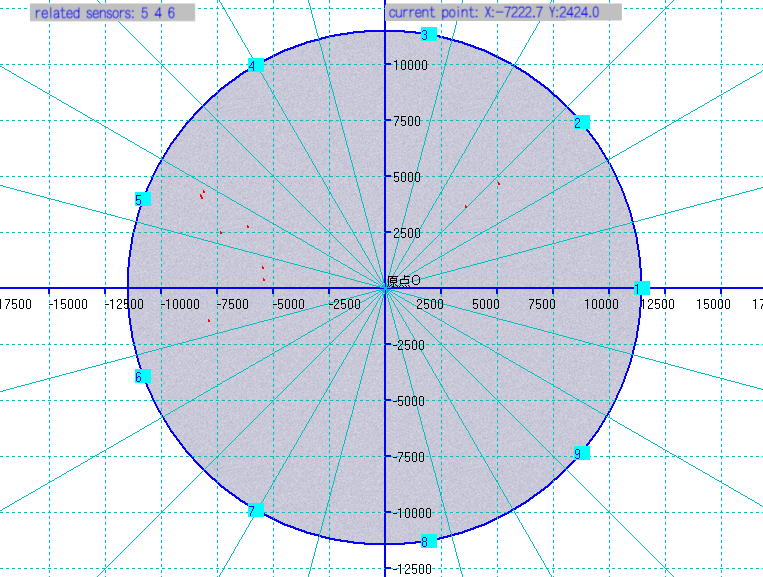
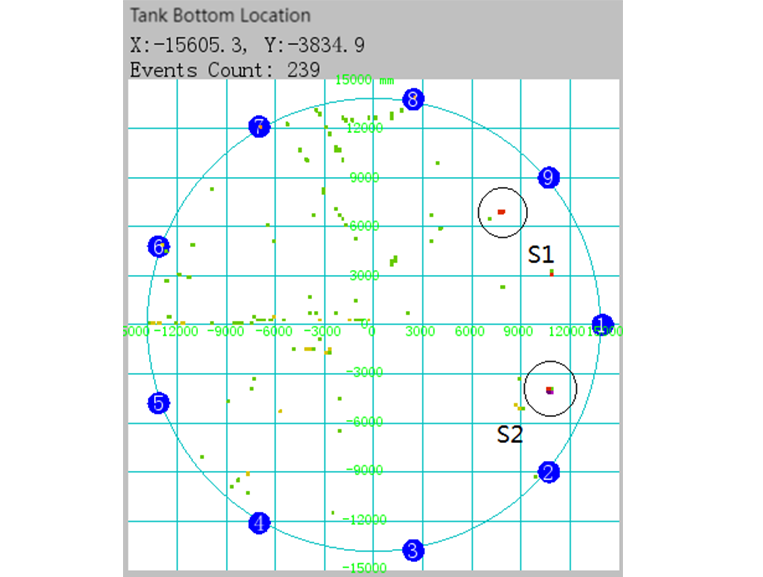
Fig 1.4 Tank #2 TDOA Location Map for 2h
-Bottom-Plate-Corrosion-Detection-Monitoring_13.png)
Fig 1.5 Location Map when Pressure Maintaining
According to Section 9.2 of the standard “JB/T 10764-2023”, the time difference location analysis and classification methods of the tank bottom acoustic emission source were adopted. The length of 10% of the diameter was used to delineate a circular assessment area. Perform local analysis on all location sources with relatively concentrated events within the evaluation area and calculate the number of location events E per hour. According to Figure 1.5, three were 173 effective events during pressure maintenance and there were 3 relatively concentrated locating areas, defined as S1, S2, and S3.
S1: E1=7; S2: E2=10; S3: E3=4.
The reference event number per hour criterion was set as a=10, based on experiences results using the same testing equipment and settings under the same environment.
Considering the liquid level height during pressure maintenance and the comprehensive acoustic emission characteristic parameters, the classification result was Level I, which means “there are no signs of local corrosion, and the corrosion condition is minimal”. The repairing suggestion: do not consider repair. It is recommended to conduct acoustic emission testing again within 6 years or open the tank at an appropriate time to observe the dynamic changes of corrosion on the tank bottom plate.
4)QC Cloud Platform
Qingcheng Cloud Platform is our own developed cloud platform for all our IoT products. The QC Cloud Platform can achieve data display and analysis, configuration, alarms, data downloading and reports.
a. Cloud platform data display: real-time/historical (parameter/waveform) data, rating results, correlation graphs etc.
-Bottom-Plate-Corrosion-Detection-Monitoring_14.png)
-Bottom-Plate-Corrosion-Detection-Monitoring_15.png)
b. Cloud platform remote settings and configuration modification: remote modify sampling modes, threshold, sampling rate, filtering range, sample period and other settings.
-Bottom-Plate-Corrosion-Detection-Monitoring_16.png)
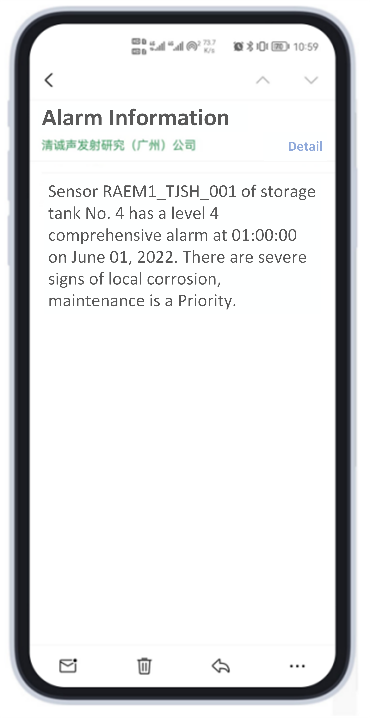
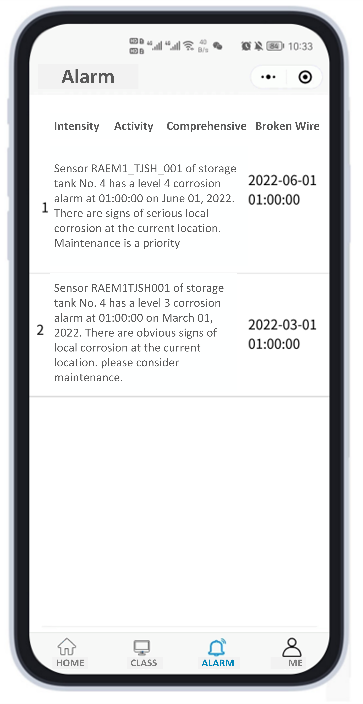
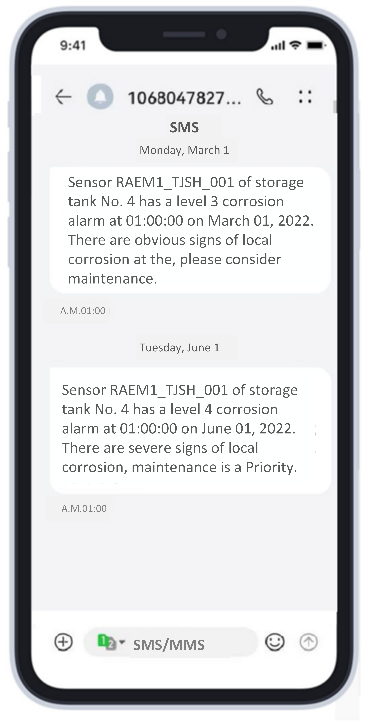
c. Automatic alarm notifications: Alarm messages are sent to the clients through SMS/emails.
d. Automatic report generation After filling in relevant information through the cloud platform, the system automatically generates a report. And download the report from the cloud platform with one clicking.
-Bottom-Plate-Corrosion-Detection-Monitoring_17.png)
5. User Cases of Acoustic Emission System
Accidents of tank bottom plate thinning and perforation leakage due to corrosion occur from time to time. According to statistics, tank failures caused by corrosion account for over 60% of all tank failures. Adopting effective tank inspection methods is of great significance for safety production, resource conservation, and environmental protection.
-Bottom-Plate-Corrosion-Detection-Monitoring_18.png )
1)Case 1: AE Detection of Storage Tanks at Xingsan Joint Station
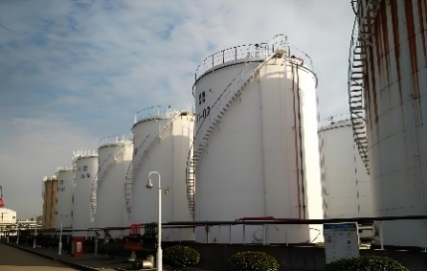
The storage tank had a volume of 5000 cubic meters, a diameter of 22.7 meters, and an effective height of 16.14 meters. It stored crude oil. The tank walls were coated with anti-corrosion paint and insulated with composite aluminum-magnesium silicate felt and sheet metal protective plates.
Acoustic emission sensor arrangement: Nine sensors were evenly distributed around the outer wall approximately 50 centimeters above the bottom plate, avoiding structural discontinuities such as pipes and manholes, with a horizontal spacing of approximately 7.8 meters.
 Tank |
 Sensor Arrangement Map |
Data acquisition and analysis: Conducted acoustic emission testing on the storage tank for 2 hours.
2)Case 2: Weld Propagation Detection in Main Absorption Tower
The storage tank had a volume of 5000 cubic meters, a diameter of 22.7 meters, and an effective height of 16.14 meters. It stored crude oil. The tank walls were coated with anti-corrosion paint and insulated with composite aluminum-magnesium silicate felt and sheet metal protective plates.
Acoustic emission sensor arrangement: Nine sensors were evenly distributed around the outer wall approximately 50 centimeters above the bottom plate, avoiding structural discontinuities such as pipes and manholes, with a horizontal spacing of approximately 7.8 meters.
-Bottom-Plate-Corrosion-Detection-Monitoring_19.png)
The monitoring of acoustic emission signals had certain characteristics, with a 24-hour cycle. Based on the difference between interference signals and crack activity signals, a parametric filtering method was used to filter out all data from the decoking process. A dataset of valid signals was obtained, and statistical analysis was performed on this valid signal data.
3)Case 3: Online Monitoring of Coke Tower
From January 4th to 6th, 2023, experimental data collection and analysis were conducted on the C-101C tower throughout its entire production cycle, aiming to explore an effective, accurate, and feasible online monitoring method for alternating fatigue vessels. The on-site 12V lithium battery provided power for approximately 34 hours. Signal acquisition for the entire coking tower production cycle was completed from 15:00 on January 4th to 1:00 on January 6th, 2023.
Sensor Installation: Monitoring focused primarily on the first and second main welds of the tower body. Waveguide rods were used for auxiliary sensor installation. The waveguide rod length was determined by ensuring the temperature at the non-welded end of the waveguide rod dropped below 60℃. The minimum waveguide rod length was greater than the insulation layer thickness. Waveguide rods could be installed using welding or high-temperature adhesive bonding.
-Bottom-Plate-Corrosion-Detection-Monitoring_20.png)
4)Case 4: AE Detection of Storage Tanks at Special No. 1 Joint Station
-Bottom-Plate-Corrosion-Detection-Monitoring_21.png)
The storage tank was an external arch roof tank with a capacity of 10000 cubic meters, a diameter of 27.75 meters, an effective height of 14.8 meters, and a storage medium of crude oil. The safe liquid level was 12.5 meters, and the initial liquid level detected was 17.8 meters. The tank wall was coated with anti-corrosion paint and had insulation boards and metal sheet metal protective plates.
5)Case 5: Acoustic Emission Testing in CUPET Tank Bottom Inspection Training
From March 6 to 12, 2017, in the oil tank area of Matanzas Port in Cuba, testing was conducted in accordance with the Chinese machinery industry standard "JB/T 10764-2007 Atmospheric Pressure Metal Storage Tank Acoustic Emission Testing and Evaluation Method".
In the past month, the loading history showed that the highest liquid level had reached 10.6 meters, and the planned liquid level for this test would rise to 10.8 meters. According to the circumference design of the probe position, the actual number of channels used was 29, and the sensor spacing was about 8 meters. Finally, a comprehensive inspection was conducted on the storage tank group of the Cuban National Oil Company. Based on the distribution of hit numbers, a specific implementation plan for inspection of opening the tank was determined, and the qualification standards for subsequent annual inspections were formulated based on the results of the open tank.
-Bottom-Plate-Corrosion-Detection-Monitoring_22.png )
-Bottom-Plate-Corrosion-Detection-Monitoring_23.png)
6)Case 6: Acoustic Emission Detection of Storage Tanks in Zhongyuan Oil Field
-Bottom-Plate-Corrosion-Detection-Monitoring_24.png)
Entrusted by the Oil and Gas Storage and Transportation Management Office of Zhongyuan Oil field, our company conducted acoustic (acoustic emission) inspection on the 20000m3 storage tank of Zhongyuan Oil field in August 2006.
7)Jiangxi Special Inspection Institute - Jiujiang Petrochemical Storage Tank Bottom Inspection
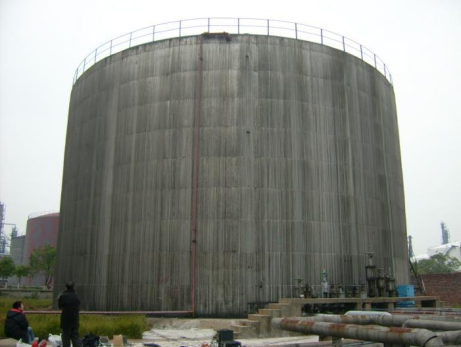 Storage Tank Exterior |
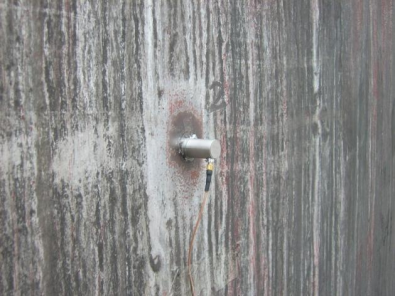 Sensor Installation |
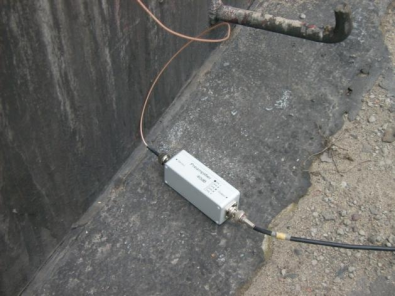 Preamplifier |
 Acquisition system |
6. FAQ
Q1: How does AE detect storage tanks?
ensors (probes) receive these acoustic emission signals, analyze their frequency, amplitude, energy, arrival time, and other characteristics to determine the generation and propagation of defects (cracks, pitting, corrosion).
Q2: What kinds of tanks can be detected?
AE is suitable for metal storage tanks (carbon steel, stainless steel, aluminum alloy) and some composite material storage tanks.
Q3: Is AE monitoring suitable for in-service tanks?
Yes, AE is very suitable for in-service tanks online monitoring. Because AE is one of the non-destructive methods. By installing AE sensors on the external wall surface of the tanks and the AE monitoring system units, it can monitor the active corrosion or cracking of the tanks in real-time without stopping services, or without opening and cleaning the tanks.
Q4: Can AE detect early-stage cracks?
Yes, AE can detect early-stage initial cracks. But the location accuracy is affected by the sensor spacing and the material.
Q5: Can the size of a defect /remaining life be determined?
Acoustic ultrasound (AE) can determine the state and severity of defect propagation, and can estimate life by combining it with other methods (such as ultrasound testing - UT), but direct quantification is complex.
Q6: How many sensors are required?
It depends on the tank size. A row of sensors is placed on the tank wall near to the tank floor, and it shall be ensured that they are above the height of the sediment in the tank. Thick layers of sediment affect the sensitivity of AE.
If there are manholes, nozzles and welded structures between two adjacent sensors, the maximum spacing shall not exceed 13 m. We recommend the sensor spacing doesn’t exceed 11m. But it is highly suggested to do the attenuation test on site to confirm the attenuation distance and then to decide the final sensor spacing.
7. Technical Documents and Videos
 Find detail monitoring scheme.pdf
![]() Storage Tank Floor Detection by SAEU3H Acoustic Emission Testing System video
Storage Tank Floor Detection by SAEU3H Acoustic Emission Testing System video ![]()
Contact Form
Please complete the form below to request your quote. We will be in contact as soon as possible.